NVDA Trading Predictions
1 Day Prediction
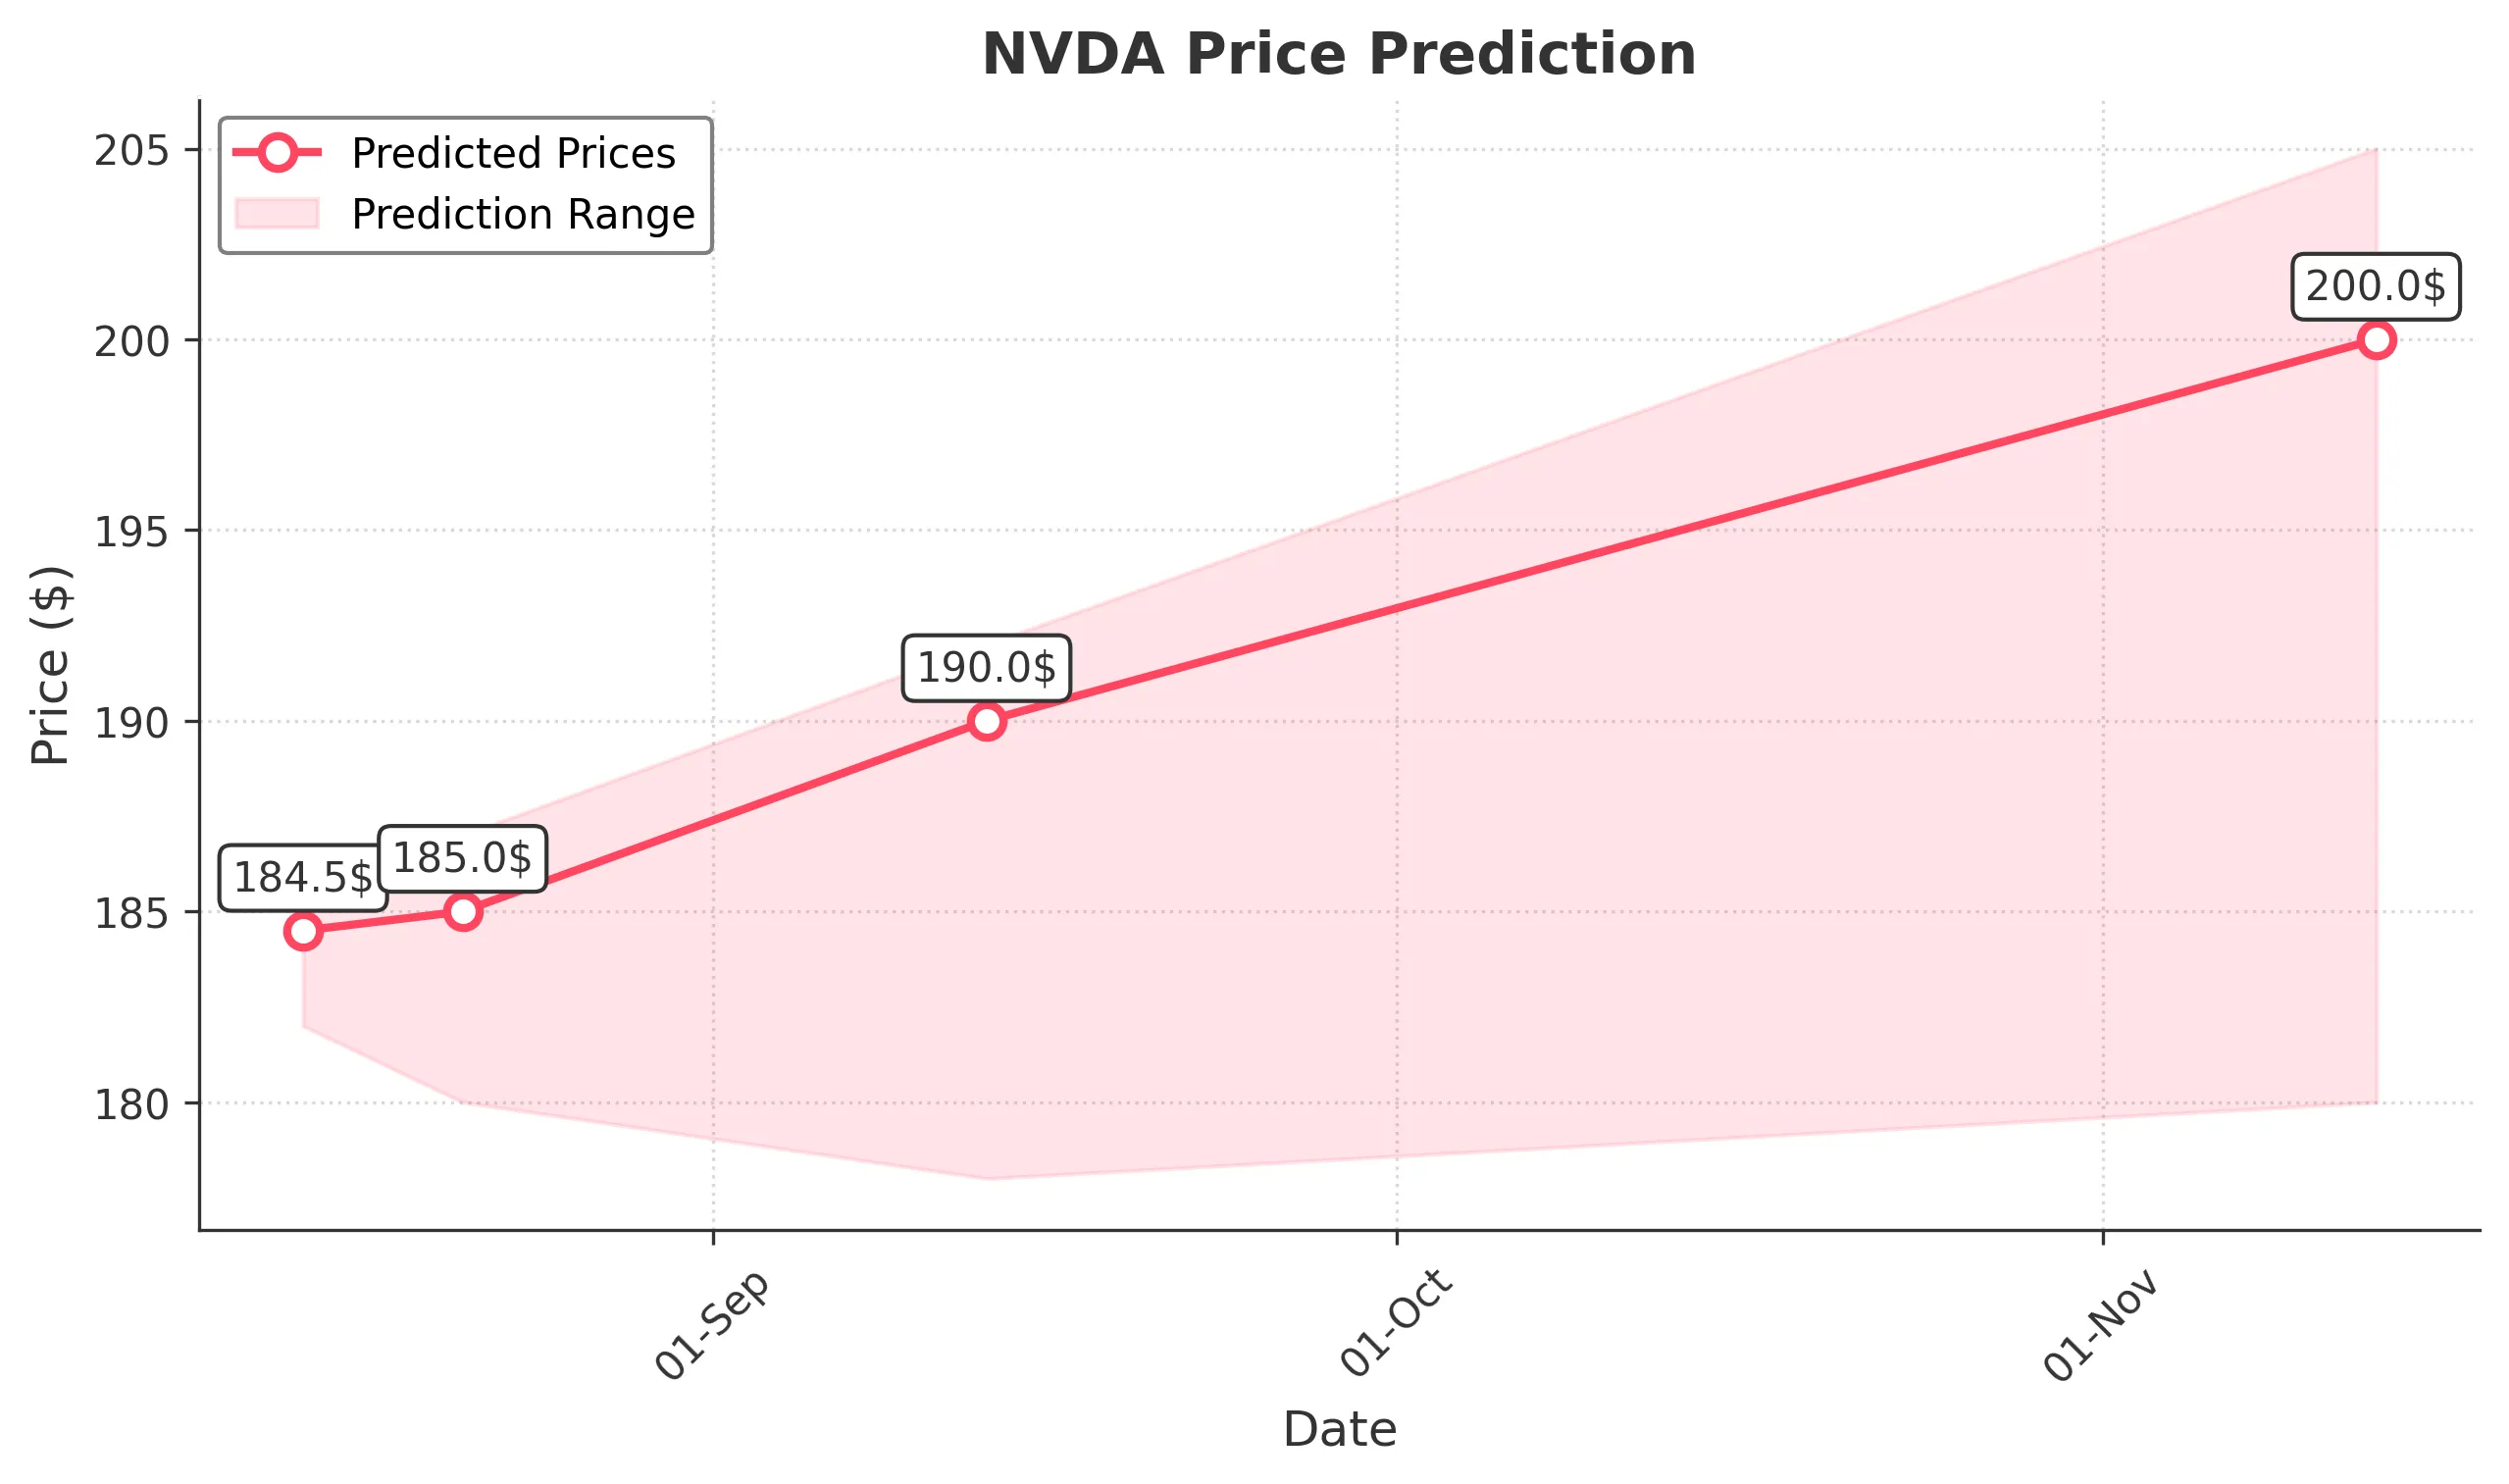
Target: August 14, 2025$184.5
$183.5
$185.5
$182
Description
The stock shows bullish momentum with a recent upward trend. The RSI is approaching overbought levels, indicating potential for a pullback. However, strong volume and a bullish candlestick pattern suggest a continuation of the upward trend.
Analysis
Over the past 3 months, NVDA has shown a bullish trend, with significant support at $170 and resistance around $185. The MACD indicates upward momentum, while the ATR suggests moderate volatility. Recent volume spikes indicate strong buying interest.
Confidence Level
Potential Risks
Potential market volatility and profit-taking could lead to a price correction.
1 Week Prediction
Target: August 21, 2025$185
$184
$187
$180
Description
The stock is expected to maintain its bullish trend, supported by strong fundamentals and positive market sentiment. However, the RSI indicates overbought conditions, which may lead to short-term corrections.
Analysis
NVDA has been on an upward trajectory, with key support at $180. The MACD remains bullish, and the Bollinger Bands suggest potential for further price increases. Volume trends indicate strong investor interest.
Confidence Level
Potential Risks
Market corrections or negative news could impact the stock's performance.
1 Month Prediction
Target: September 13, 2025$190
$185.5
$192
$178
Description
The stock is likely to continue its upward trend, driven by strong earnings and market demand. However, the RSI suggests caution as it approaches overbought territory, indicating potential for a pullback.
Analysis
In the last three months, NVDA has shown a strong bullish trend with significant resistance at $190. The MACD and moving averages support continued upward movement, but the RSI indicates potential overextension.
Confidence Level
Potential Risks
Economic factors and market sentiment shifts could lead to volatility.
3 Months Prediction
Target: November 13, 2025$200
$195
$205
$180
Description
Long-term bullish sentiment is expected to prevail, supported by strong fundamentals and market trends. However, potential economic downturns or sector-specific issues could pose risks.
Analysis
NVDA has shown resilience with a bullish trend over the past three months. Key support is at $180, while resistance is at $200. The MACD indicates a strong upward trend, but external economic factors could introduce volatility.
Confidence Level
Potential Risks
Market corrections and external economic factors could impact the stock's trajectory.