OIL Trading Predictions
1 Day Prediction
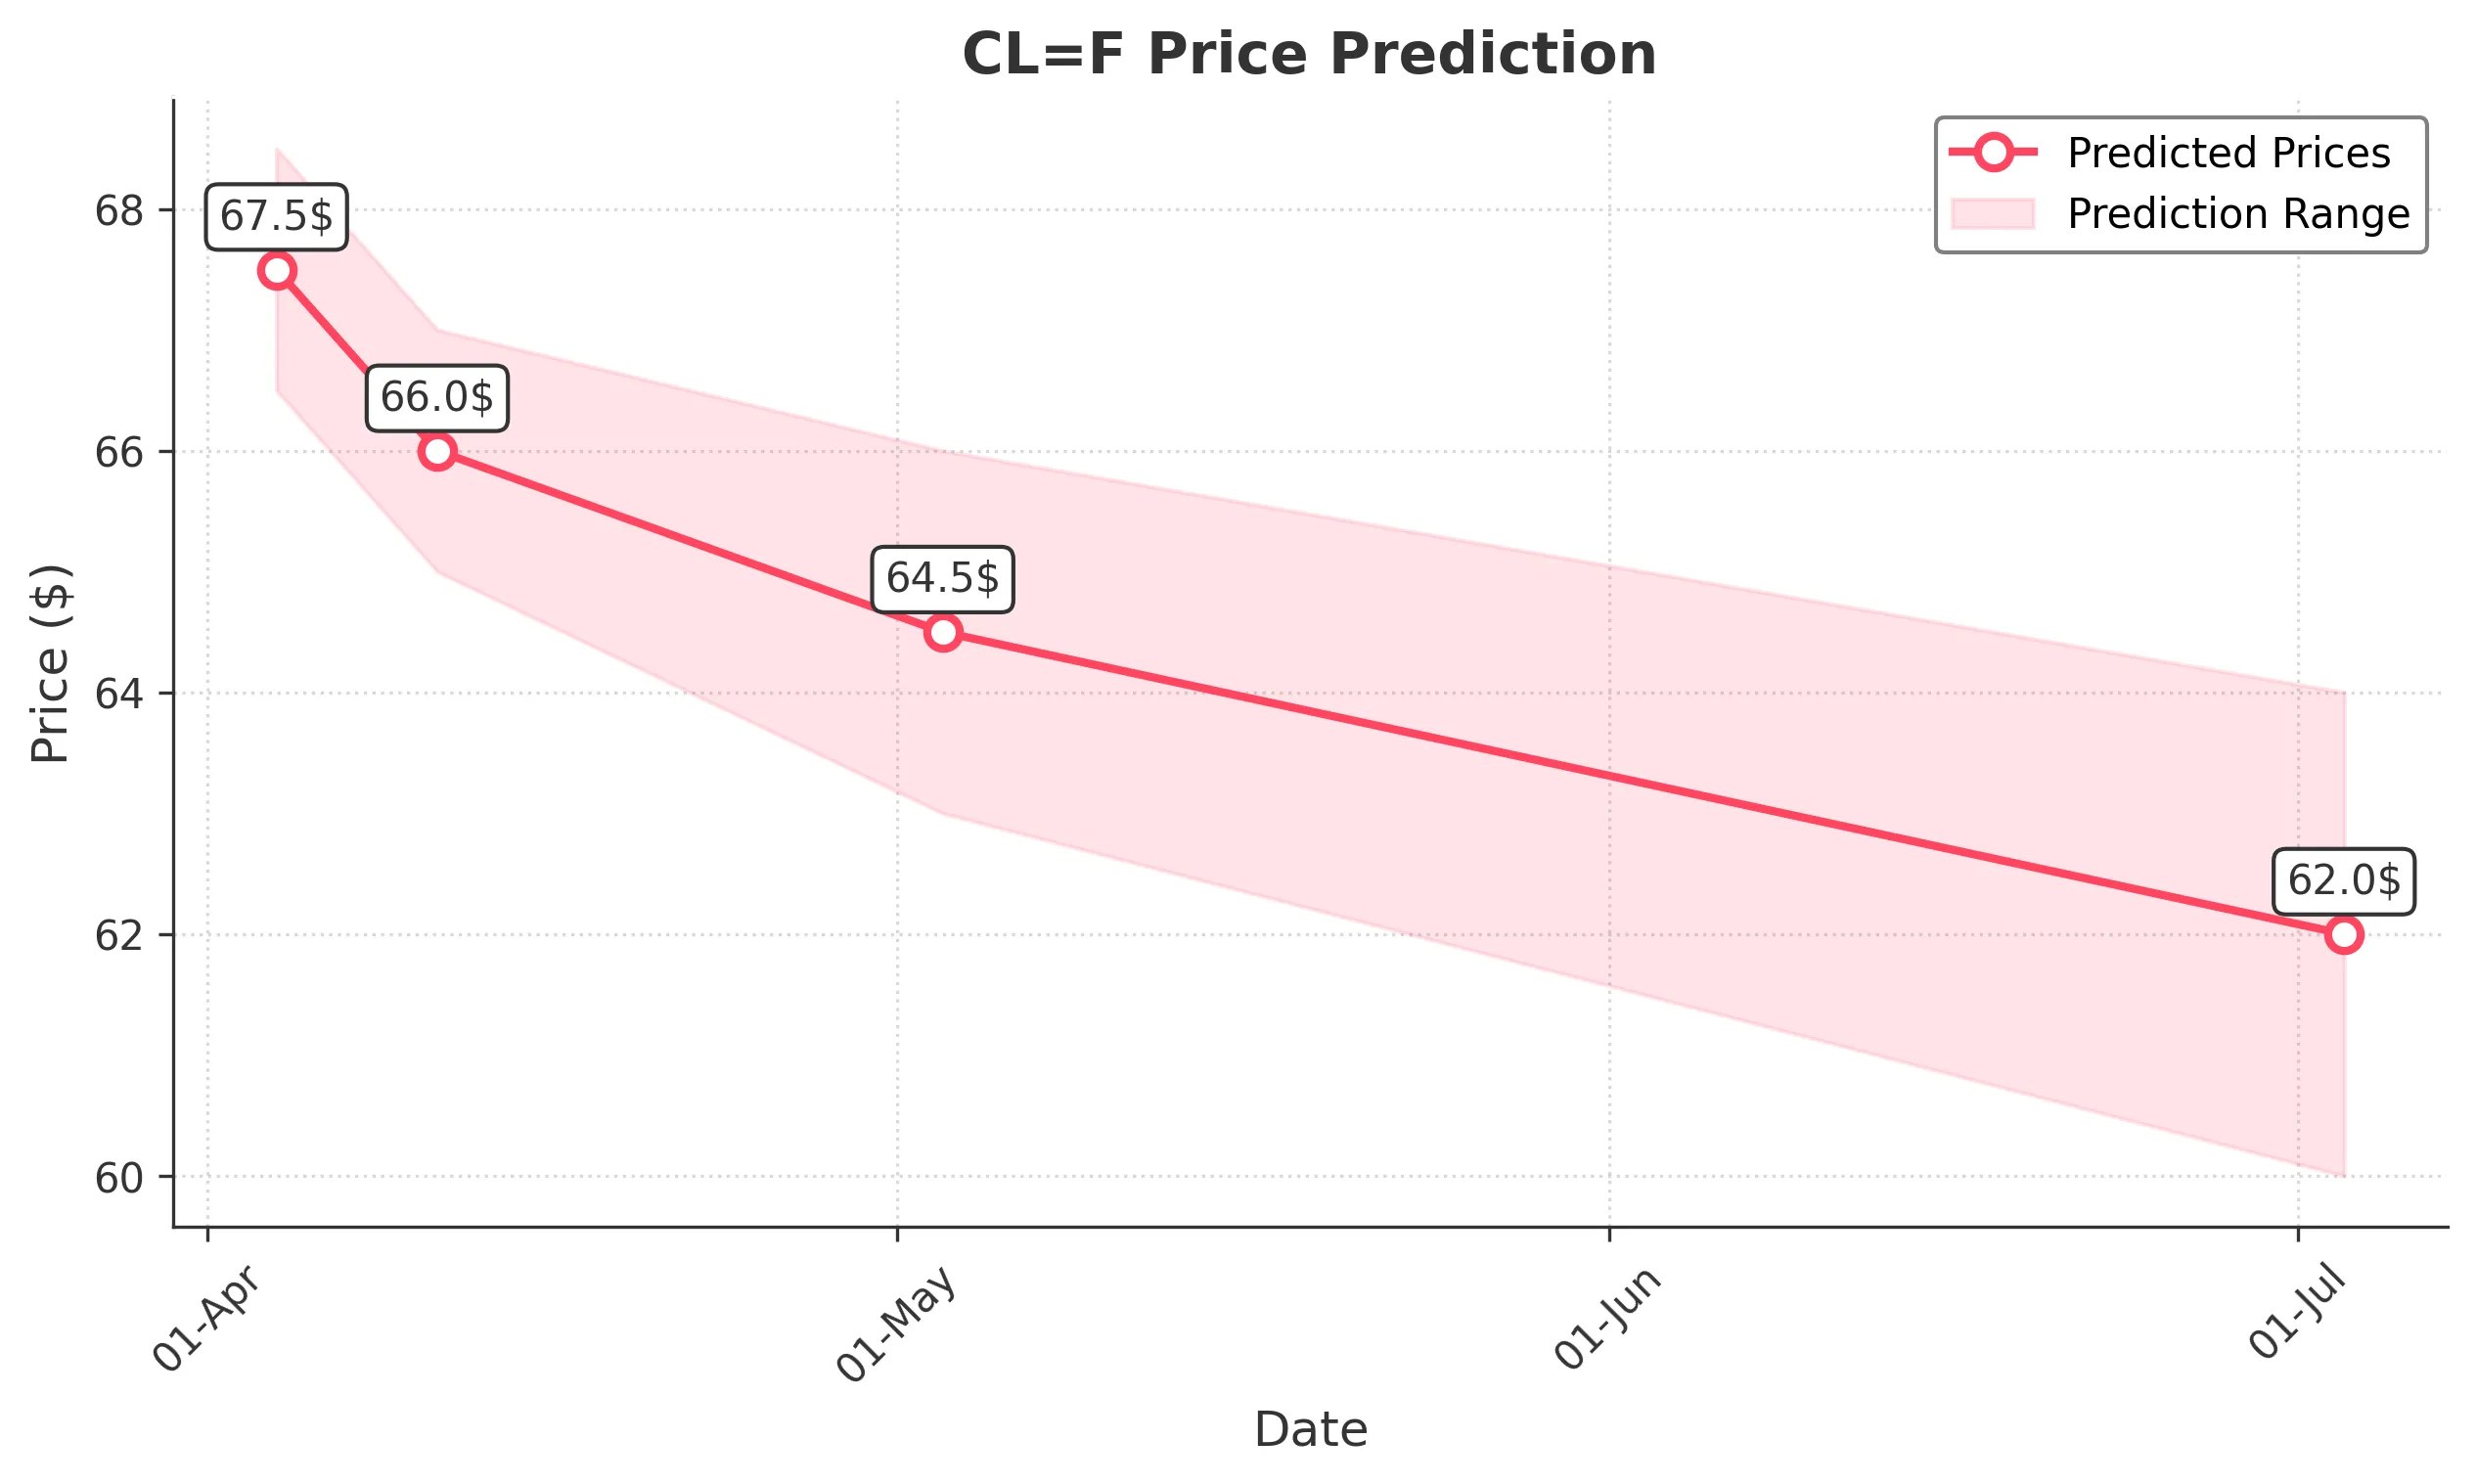
Target: April 4, 2025$67.5
$67.2
$68.5
$66.5
Description
The stock shows bearish momentum with a recent close below key support levels. RSI indicates oversold conditions, but MACD is bearish. Expect a slight recovery but overall weakness persists.
Analysis
Over the past 3 months, CL=F has shown a bearish trend with significant resistance around 72. The recent drop below 70 indicates weakness. Volume spikes on down days suggest selling pressure. Technical indicators like MACD and RSI confirm bearish sentiment.
Confidence Level
Potential Risks
Market volatility and external news could impact the prediction. A sudden bullish reversal is possible if sentiment shifts.
1 Week Prediction
Target: April 11, 2025$66
$66.5
$67
$65
Description
Continued bearish sentiment is expected as the stock struggles to maintain above recent lows. Volume analysis shows persistent selling pressure, and technical indicators suggest further declines.
Analysis
The stock has been in a downtrend, with key support at 66. Recent trading volumes indicate increased selling. Technical indicators like Bollinger Bands suggest potential for further declines, while ATR indicates rising volatility.
Confidence Level
Potential Risks
Potential for unexpected market news or economic data could alter the trend. Watch for any bullish reversal patterns.
1 Month Prediction
Target: May 3, 2025$64.5
$65
$66
$63
Description
The bearish trend is likely to continue as the stock approaches critical support levels. Technical indicators suggest further downside potential, with RSI indicating oversold conditions.
Analysis
CL=F has been trending downwards, with significant resistance at 70. The stock is approaching key support levels, and technical indicators suggest a potential bounce, but overall sentiment remains bearish.
Confidence Level
Potential Risks
Market sentiment can shift quickly, and any positive news could lead to a reversal. Watch for signs of accumulation.
3 Months Prediction
Target: July 3, 2025$62
$63
$64
$60
Description
Long-term bearish outlook as the stock continues to face selling pressure. Key support levels are at risk, and technical indicators suggest further declines.
Analysis
The stock has shown a consistent downtrend over the past months, with significant resistance at 70. Volume patterns indicate persistent selling, and technical indicators like MACD and RSI confirm bearish sentiment. External factors could influence future performance.
Confidence Level
Potential Risks
Unforeseen macroeconomic events or changes in market sentiment could lead to volatility. A reversal is possible if bullish patterns emerge.