OIL Trading Predictions
1 Day Prediction
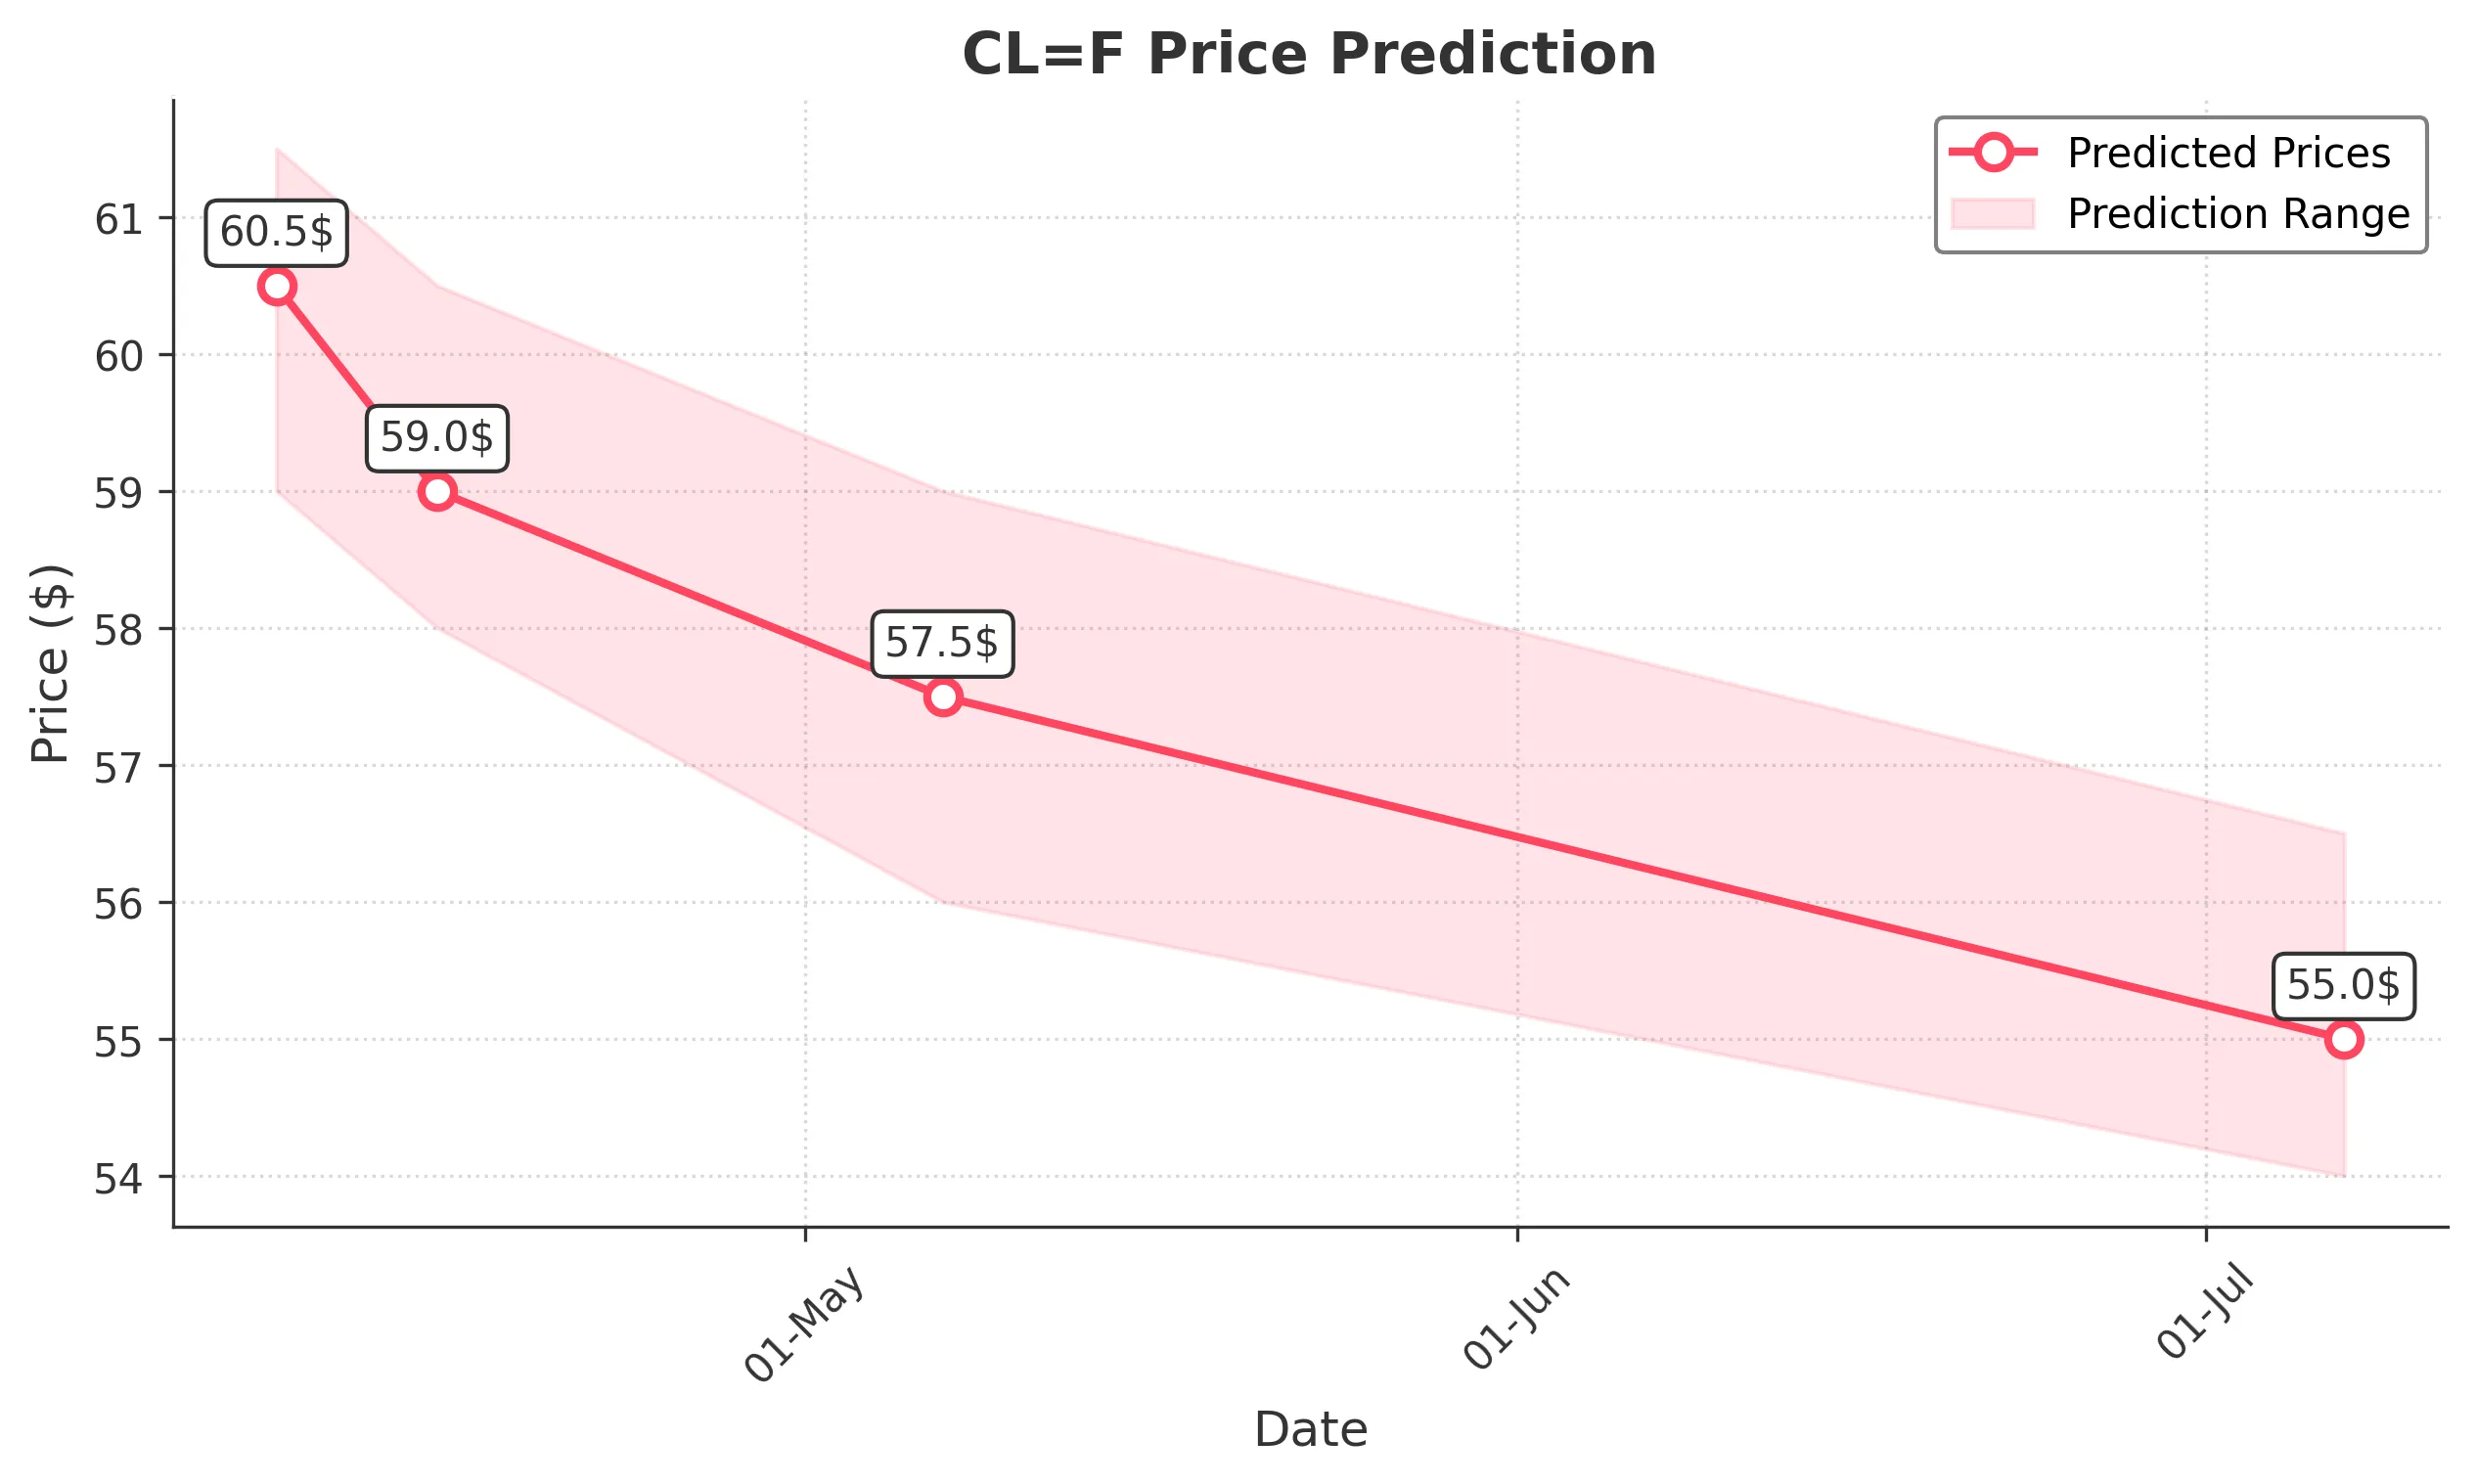
Target: April 8, 2025$60.5
$60.860001
$61.5
$59
Description
The stock shows bearish momentum with a recent drop in price and volume. The RSI indicates oversold conditions, but the MACD is bearish. Expect a slight recovery but overall weakness persists.
Analysis
Over the past 3 months, CL=F has shown a bearish trend, with significant resistance around 72. The recent drop below 65 indicates weakness. Volume spikes on down days suggest selling pressure. The ATR indicates increased volatility.
Confidence Level
Potential Risks
Market volatility and potential news could impact the price unexpectedly.
1 Week Prediction
Target: April 15, 2025$59
$60.5
$60.5
$58
Description
Continued bearish sentiment is expected as the stock struggles to find support. The Bollinger Bands indicate a potential squeeze, but the overall trend remains downward.
Analysis
The stock has been in a downtrend, with key support at 58. Recent candlestick patterns show indecision, but the overall sentiment is bearish. Volume analysis indicates selling pressure, and the RSI remains low.
Confidence Level
Potential Risks
Unforeseen macroeconomic events could lead to sudden price changes.
1 Month Prediction
Target: May 7, 2025$57.5
$59
$59
$56
Description
The bearish trend is likely to continue, with potential for further declines as the stock approaches key support levels. The MACD remains negative, indicating sustained downward momentum.
Analysis
CL=F has been trending downwards, with significant resistance at 65. The stock is approaching critical support levels, and the overall market sentiment is bearish. Volume patterns suggest continued selling pressure.
Confidence Level
Potential Risks
Market sentiment could shift due to external factors, impacting the prediction.
3 Months Prediction
Target: July 7, 2025$55
$56
$56.5
$54
Description
The stock is expected to remain under pressure, with potential for further declines as it tests lower support levels. The overall market sentiment is bearish, and macroeconomic factors may exacerbate this trend.
Analysis
The stock has shown a consistent downtrend, with significant resistance at 60. The recent price action indicates weakness, and the overall sentiment remains negative. Volume spikes on down days suggest continued selling pressure.
Confidence Level
Potential Risks
Potential for market recovery or unexpected news could alter the trajectory.