OIL Trading Predictions
1 Day Prediction
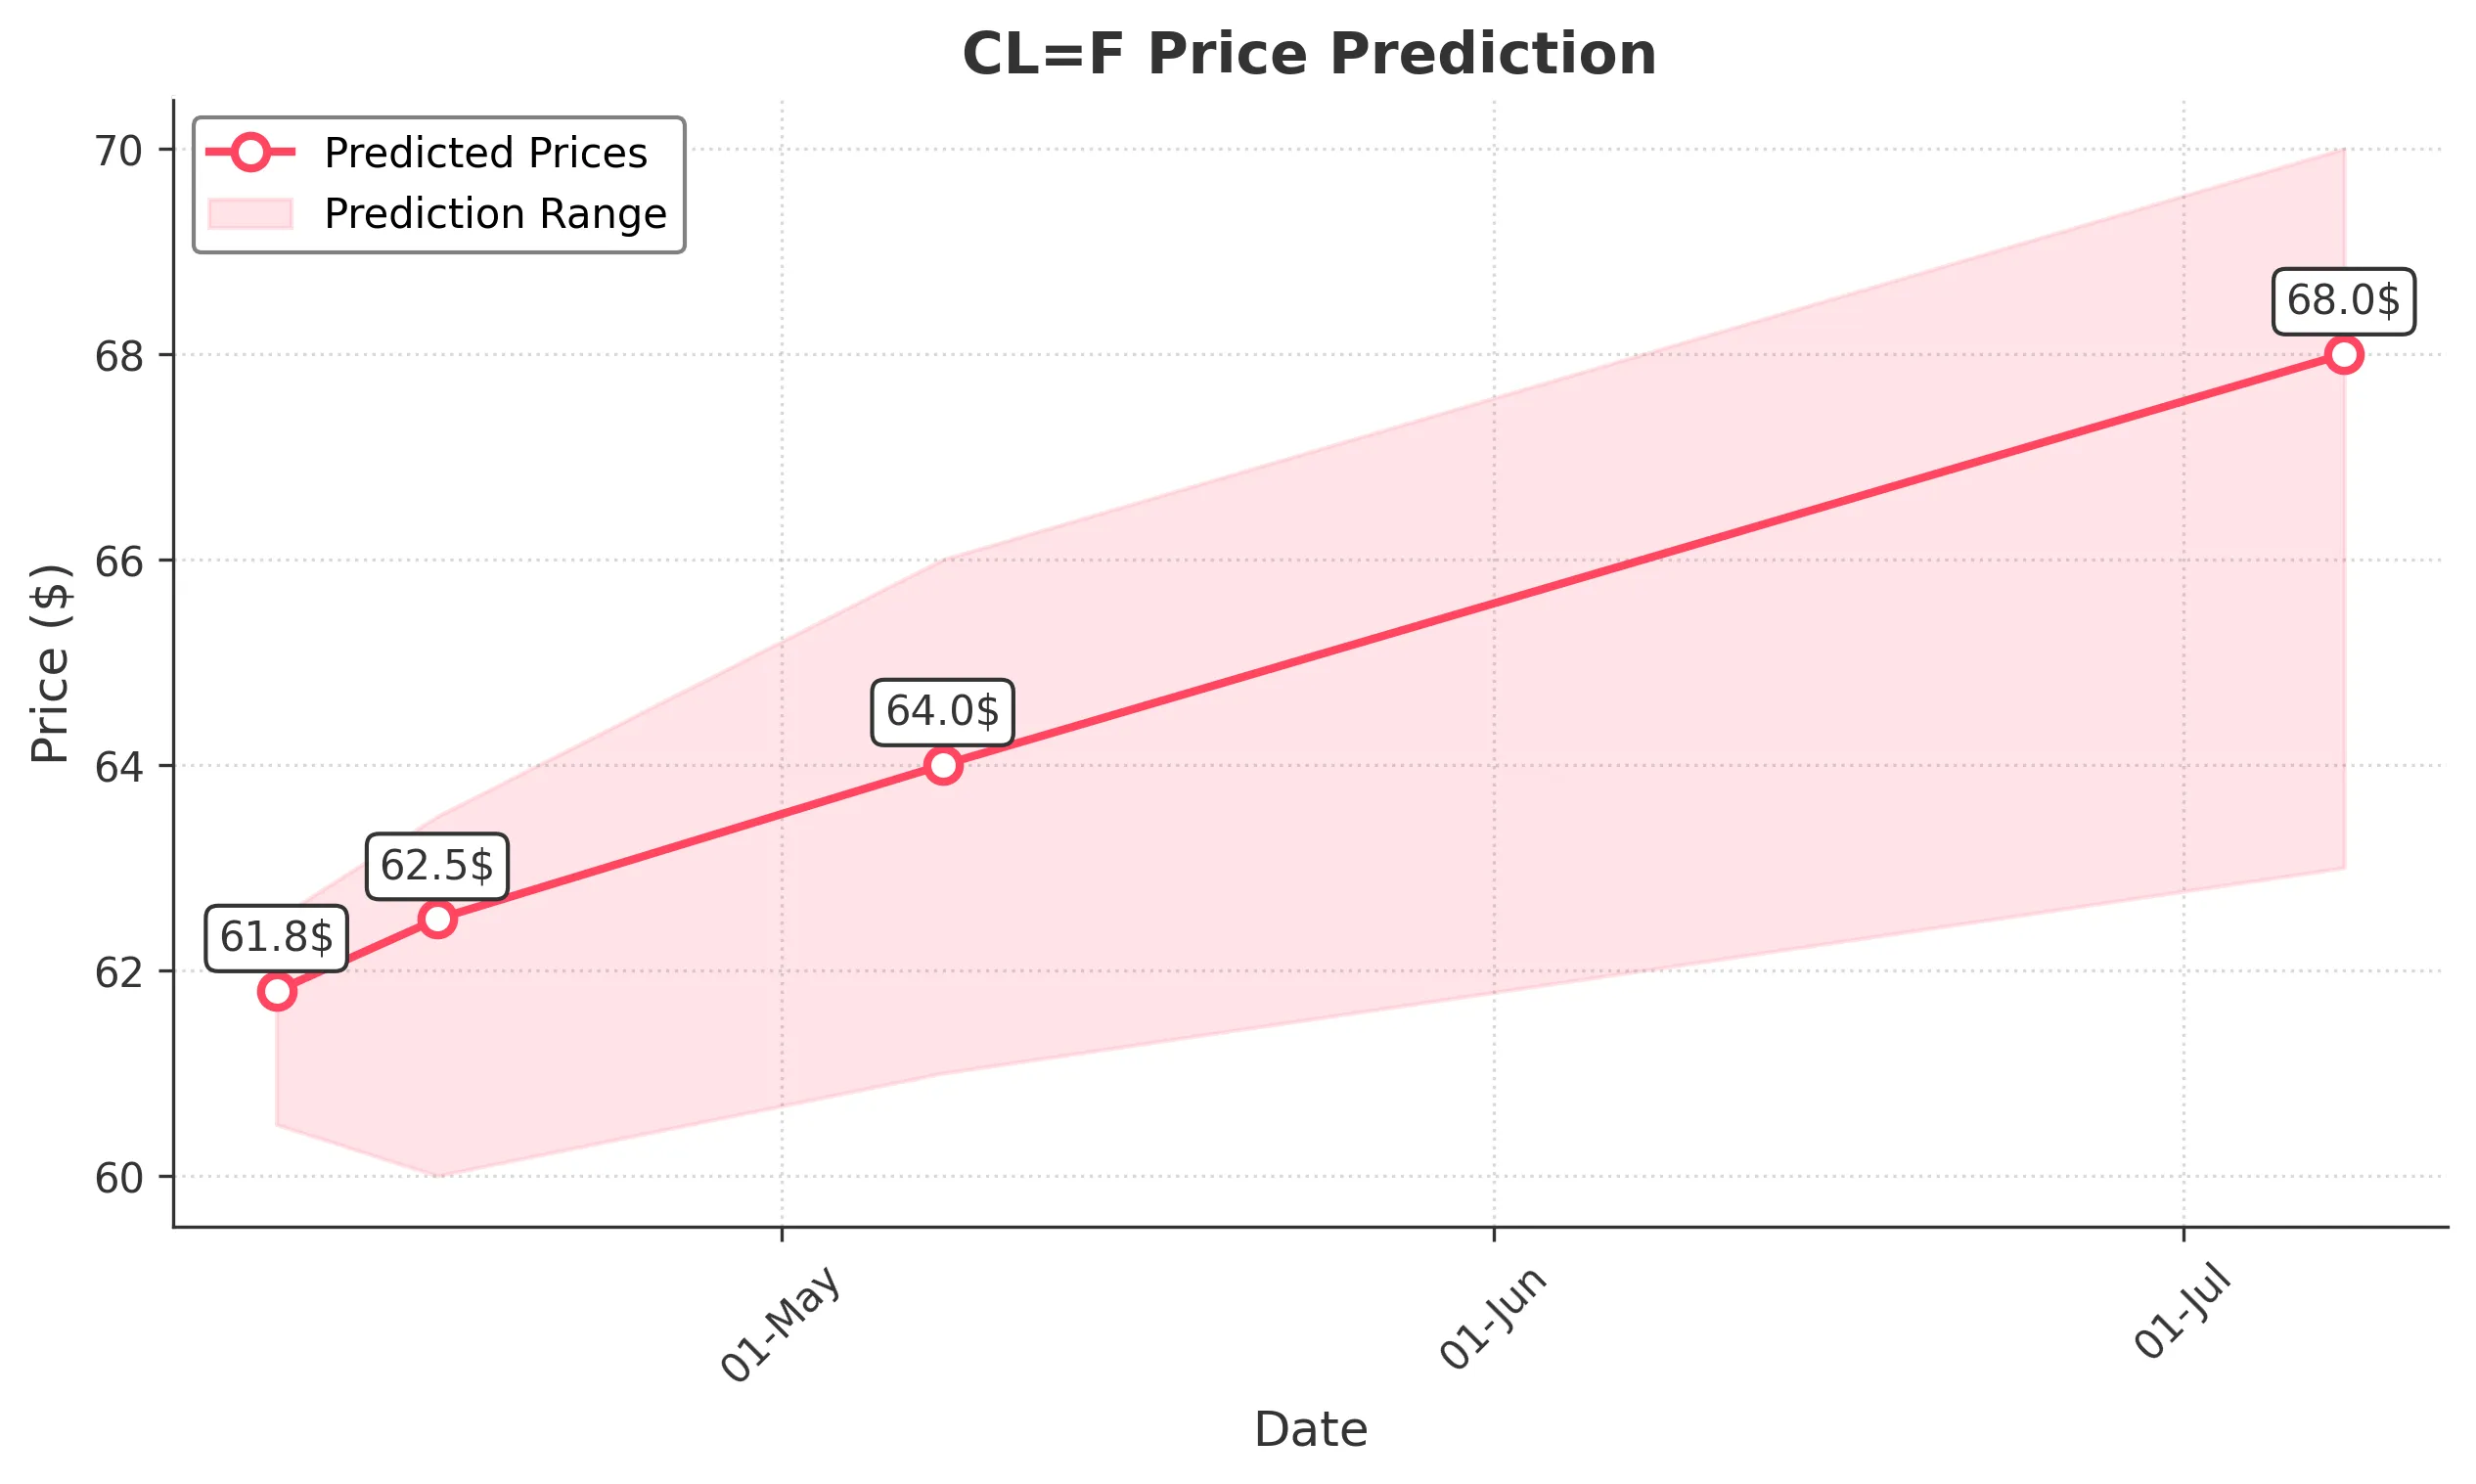
Target: April 9, 2025$61.8
$61.7
$62.5
$60.5
Description
The stock shows a slight bullish trend after recent declines. RSI indicates oversold conditions, suggesting a potential bounce. However, resistance at 62.50 may limit upside. Volume remains low, indicating caution among traders.
Analysis
Over the past 3 months, CL=F has shown a bearish trend with significant declines. Key support is around 60.50, while resistance is at 62.50. The recent drop in volume suggests a lack of conviction in the current trend. Technical indicators like MACD are bearish, but RSI shows potential for a short-term recovery.
Confidence Level
Potential Risks
Market volatility and external news could impact the prediction. A strong bearish sentiment could lead to further declines.
1 Week Prediction
Target: April 16, 2025$62.5
$61.8
$63.5
$60
Description
A potential recovery is anticipated as the stock approaches key support levels. The RSI is improving, indicating a possible reversal. However, resistance at 63.50 may pose challenges. Volume trends suggest cautious optimism.
Analysis
The stock has been in a downtrend, with significant support at 60.00. Recent candlestick patterns indicate indecision, while the MACD shows signs of potential bullish divergence. Volume has been declining, suggesting a lack of strong buying interest.
Confidence Level
Potential Risks
Unforeseen market events or economic data releases could disrupt the expected recovery. The bearish trend may still dominate.
1 Month Prediction
Target: May 8, 2025$64
$62.5
$66
$61
Description
A gradual recovery is expected as the stock stabilizes above support levels. The RSI is moving towards neutral territory, indicating reduced selling pressure. However, resistance at 66.00 remains a concern.
Analysis
The stock has shown a bearish trend with key support at 60.00. Recent price action suggests a potential bottoming pattern, but the overall sentiment remains cautious. Technical indicators are mixed, with the MACD showing signs of potential recovery, but volume remains low.
Confidence Level
Potential Risks
Market sentiment remains fragile, and any negative news could reverse the recovery. The potential for further declines exists if resistance levels hold.
3 Months Prediction
Target: July 8, 2025$68
$66.5
$70
$63
Description
A more sustained recovery is anticipated as the stock breaks above key resistance levels. Improved market sentiment and potential bullish patterns may drive prices higher. However, macroeconomic factors could still pose risks.
Analysis
The stock has been in a bearish phase, but signs of recovery are emerging. Key resistance at 66.00 and support at 60.00 are critical levels to watch. Technical indicators suggest a potential bullish reversal, but overall market sentiment remains cautious.
Confidence Level
Potential Risks
Economic indicators and geopolitical events could impact market conditions. The potential for a bearish reversal remains if resistance levels are not convincingly broken.