OIL Trading Predictions
1 Day Prediction
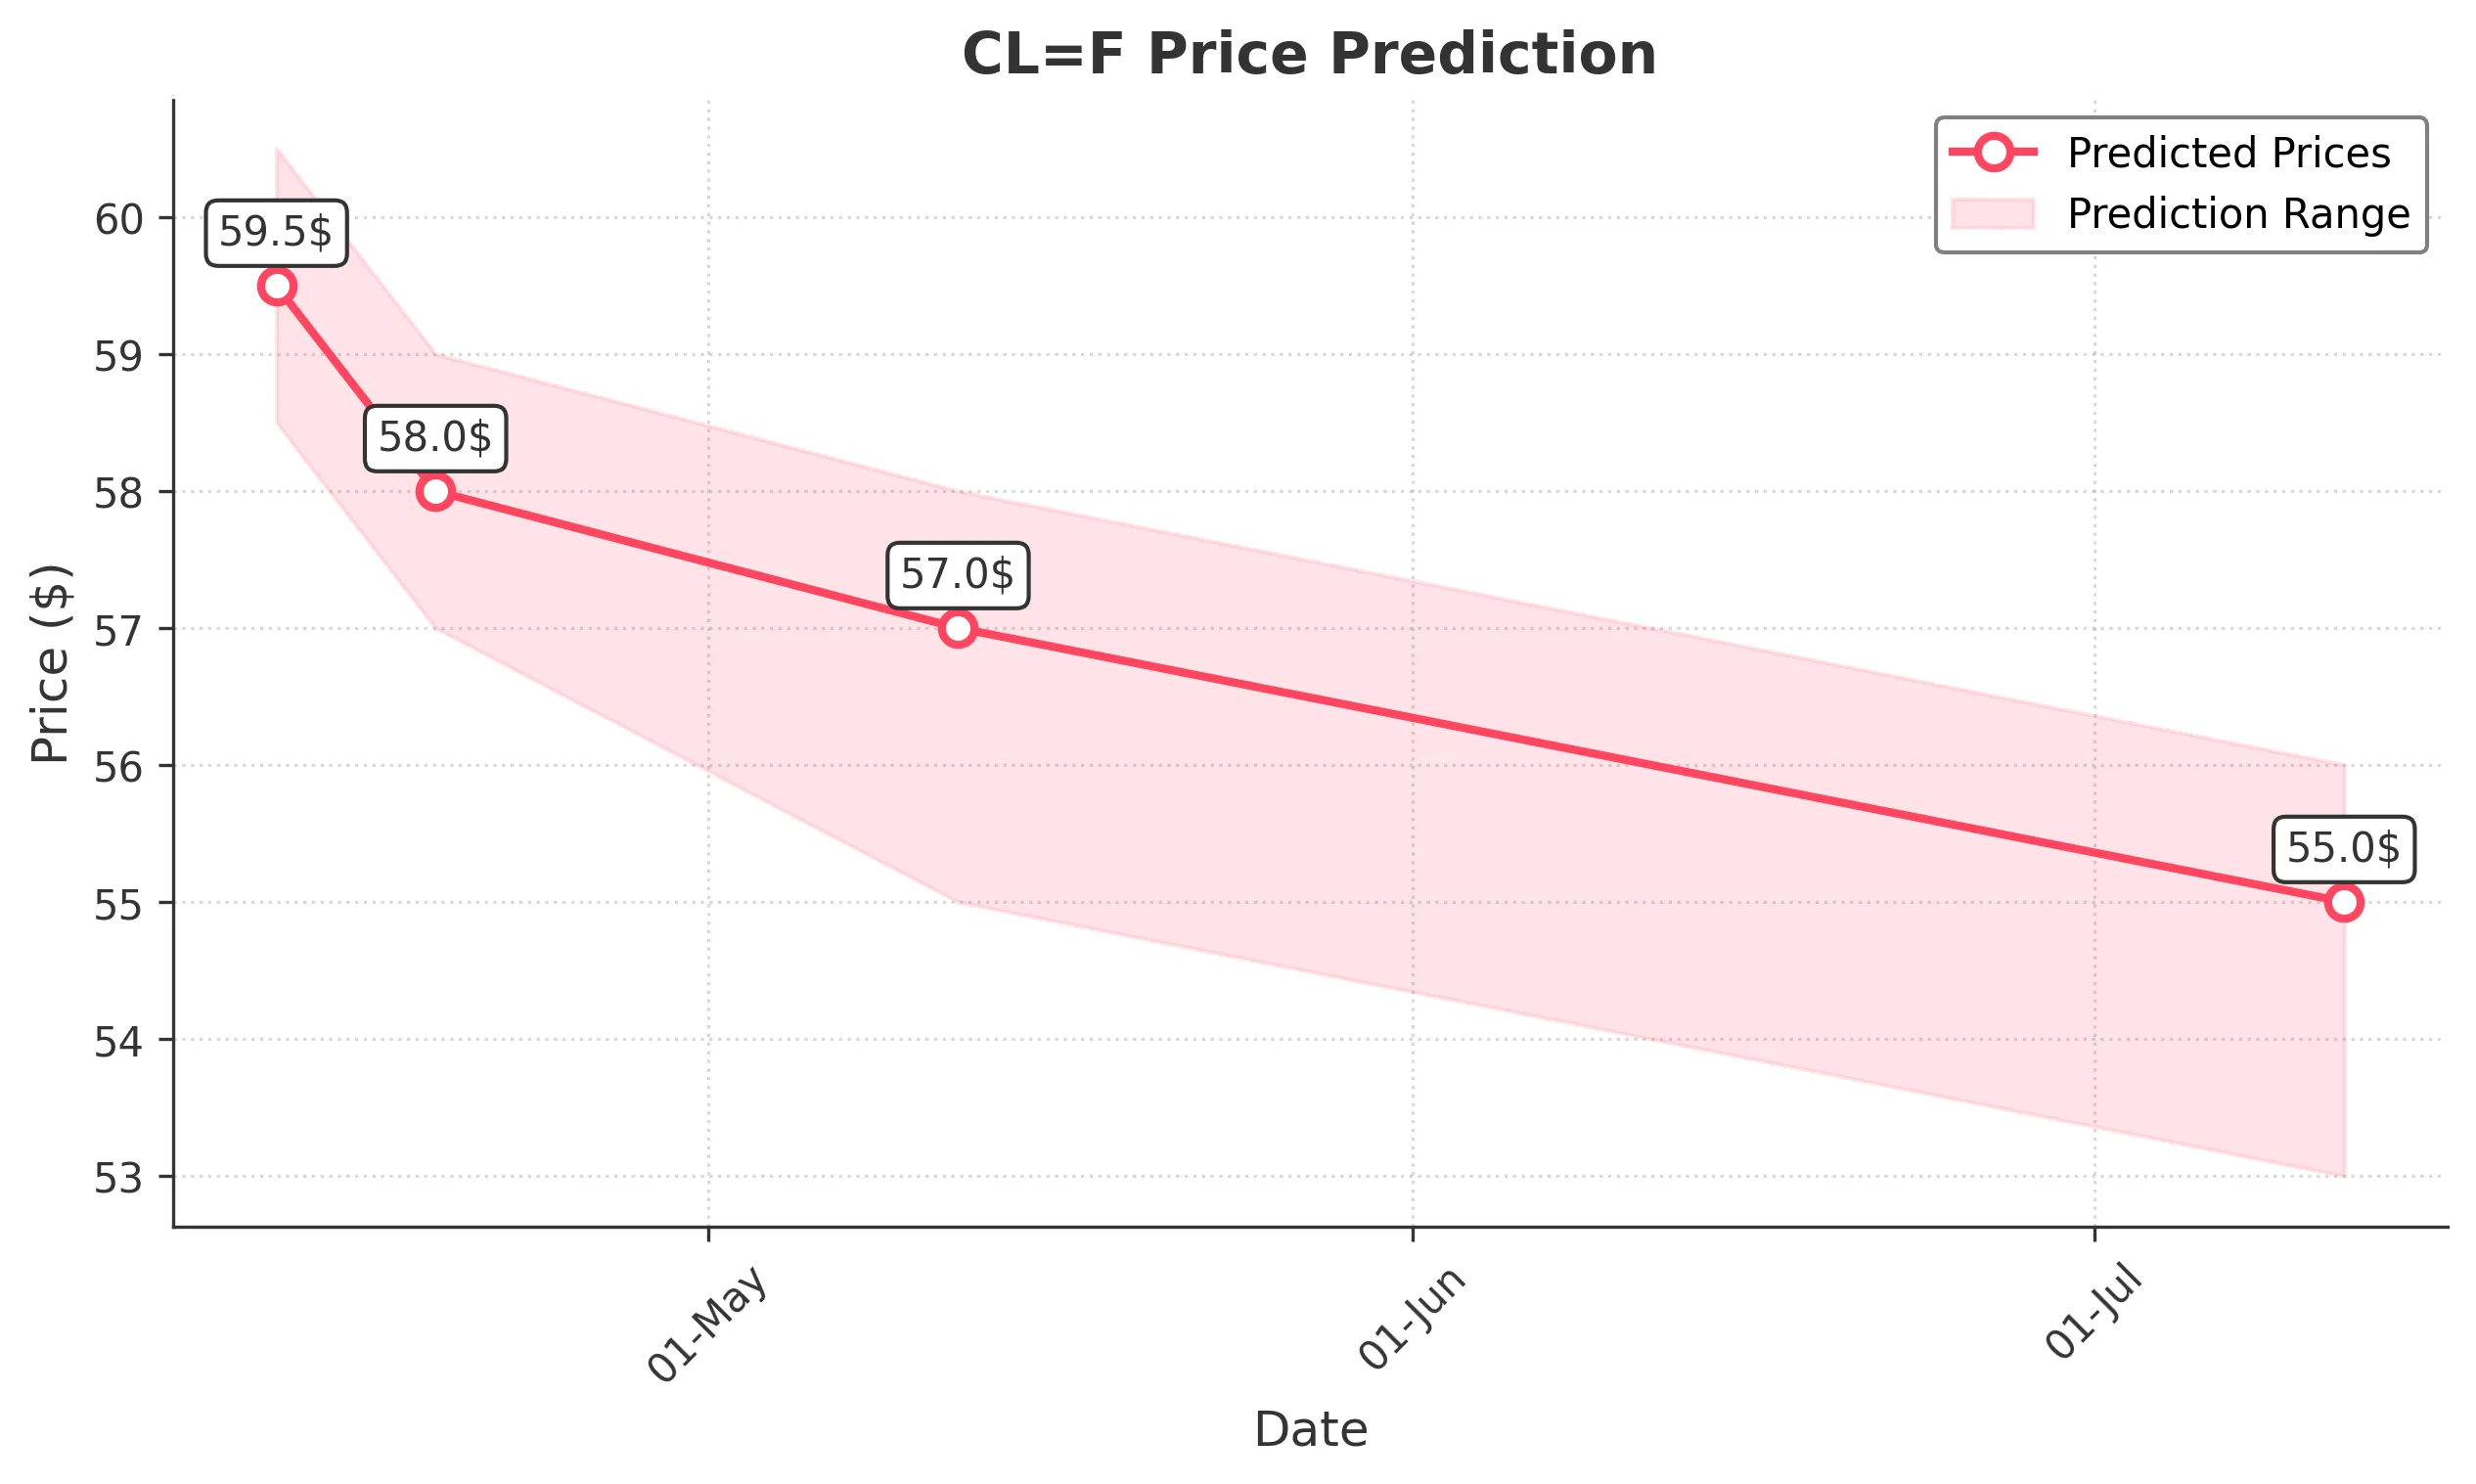
Target: April 12, 2025$59.5
$59.8
$60.5
$58.5
Description
The stock shows bearish momentum with a recent downtrend. The RSI indicates oversold conditions, but the MACD is negative. A potential bounce could occur, but overall sentiment remains weak.
Analysis
Over the past 3 months, CL=F has shown a bearish trend, with significant support around $60. Technical indicators like the MACD and RSI suggest weakness. Volume spikes on down days indicate selling pressure. Recent macroeconomic factors may also weigh on sentiment.
Confidence Level
Potential Risks
Market volatility and external news could impact the prediction. A sudden positive catalyst may reverse the trend.
1 Week Prediction
Target: April 19, 2025$58
$58.5
$59
$57
Description
The bearish trend is expected to continue, with potential for further declines. The Bollinger Bands indicate a squeeze, suggesting volatility ahead. Watch for any reversal patterns.
Analysis
The stock has been in a downtrend, with resistance at $60. The ATR indicates increasing volatility. Volume analysis shows selling pressure, and candlestick patterns suggest bearish sentiment. External economic factors may further influence the stock.
Confidence Level
Potential Risks
Unforeseen market events or news could lead to unexpected price movements. A reversal pattern could change the outlook.
1 Month Prediction
Target: May 12, 2025$57
$57.5
$58
$55
Description
Continued bearish sentiment is expected, with potential for further declines. The stock may test lower support levels. Watch for any bullish reversal signals.
Analysis
The stock has been trending downwards, with key support at $55. Technical indicators suggest weakness, and volume patterns indicate selling pressure. The market sentiment remains cautious, influenced by macroeconomic factors.
Confidence Level
Potential Risks
Market conditions are volatile, and any positive news could lead to a reversal. The potential for a bounce exists if support holds.
3 Months Prediction
Target: July 12, 2025$55
$55.5
$56
$53
Description
The bearish trend may persist, with potential for further declines. A test of lower support levels is likely. Watch for any signs of recovery.
Analysis
The stock has shown a consistent downtrend, with significant resistance at $60. Technical indicators suggest continued weakness, and volume analysis indicates selling pressure. Macroeconomic factors may further influence the stock's trajectory.
Confidence Level
Potential Risks
Long-term predictions are uncertain due to potential market shifts. Economic changes could significantly impact the stock's performance.