OIL Trading Predictions
1 Day Prediction
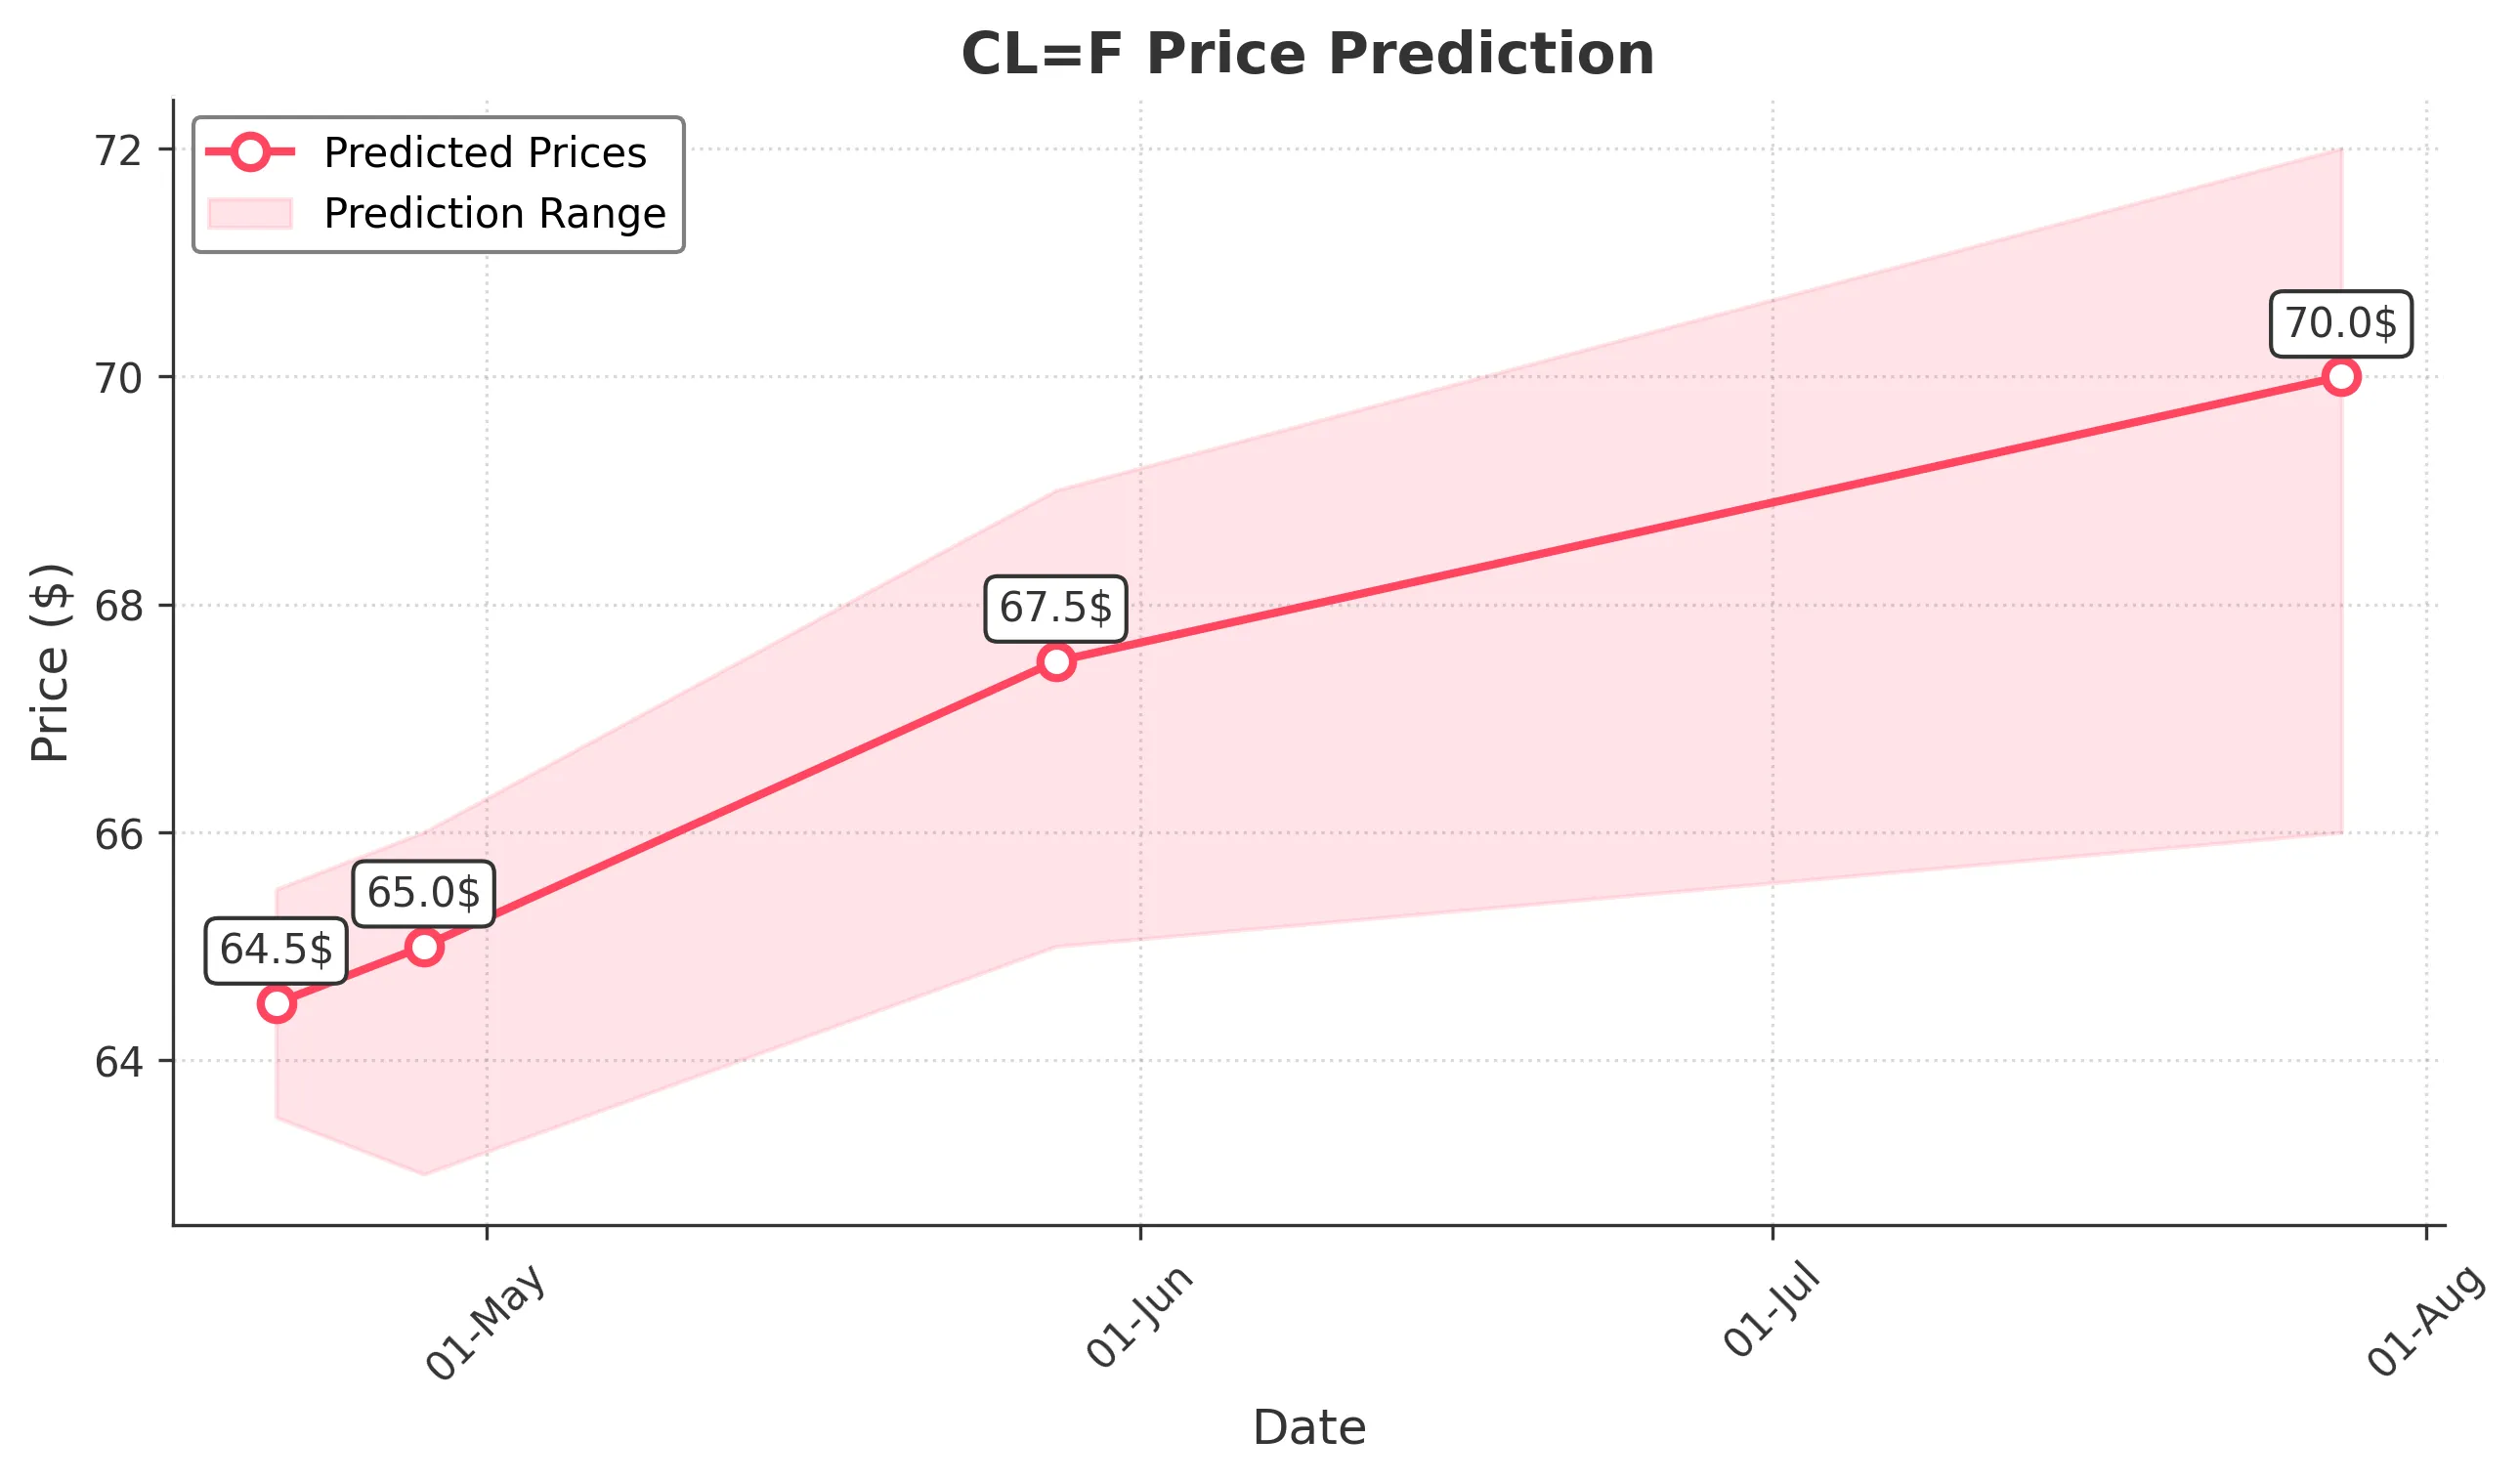
Target: April 21, 2025$64.5
$64
$65.5
$63.5
Description
The stock shows a slight bearish trend with recent lower closes. RSI indicates oversold conditions, suggesting a potential bounce. However, MACD is bearish, and volume is declining, indicating caution.
Analysis
Over the past 3 months, CL=F has shown a bearish trend with significant support around $60. Recent price action indicates a struggle to maintain upward momentum, with lower highs and lows. Technical indicators like MACD and RSI suggest potential for a short-term bounce, but overall sentiment remains cautious.
Confidence Level
Potential Risks
Market volatility and external news could impact the prediction. A sudden market shift could lead to unexpected price movements.
1 Week Prediction
Target: April 28, 2025$65
$64.5
$66
$63
Description
A potential recovery is indicated as the stock approaches key support levels. The RSI is improving, and a bullish divergence is forming. However, MACD remains bearish, suggesting caution.
Analysis
The stock has been in a downtrend, with recent attempts to recover. Key support at $60 has held, but resistance at $66 remains strong. Volume patterns show declining interest, and technical indicators suggest a mixed outlook, with potential for a short-term bounce but overall bearish sentiment.
Confidence Level
Potential Risks
Unforeseen macroeconomic events or changes in market sentiment could lead to volatility. The bearish MACD signal raises concerns about sustainability.
1 Month Prediction
Target: May 28, 2025$67.5
$66.5
$69
$65
Description
A gradual recovery is expected as the stock tests resistance levels. The RSI is moving towards neutral, indicating potential for upward momentum. However, bearish MACD signals remain a concern.
Analysis
The stock has shown signs of stabilization after a prolonged downtrend. Key resistance levels are being tested, and while there are signs of recovery, the overall sentiment remains cautious. Volume patterns indicate a lack of strong buying interest, and macroeconomic factors could influence future performance.
Confidence Level
Potential Risks
Market conditions and external factors could hinder recovery. The bearish trend in MACD suggests that upward movements may be limited.
3 Months Prediction
Target: July 28, 2025$70
$68
$72
$66
Description
A potential bullish reversal is anticipated as the stock approaches key Fibonacci retracement levels. The RSI is improving, indicating increasing buying pressure, but caution is warranted due to macroeconomic uncertainties.
Analysis
The stock has been in a bearish trend but shows signs of potential recovery. Key Fibonacci levels suggest possible support, but overall market sentiment remains mixed. Technical indicators indicate a potential for upward movement, but external factors could lead to volatility.
Confidence Level
Potential Risks
Economic conditions and geopolitical events could significantly impact market sentiment. The potential for a bearish reversal remains if resistance levels are not broken.