OIL Trading Predictions
1 Day Prediction
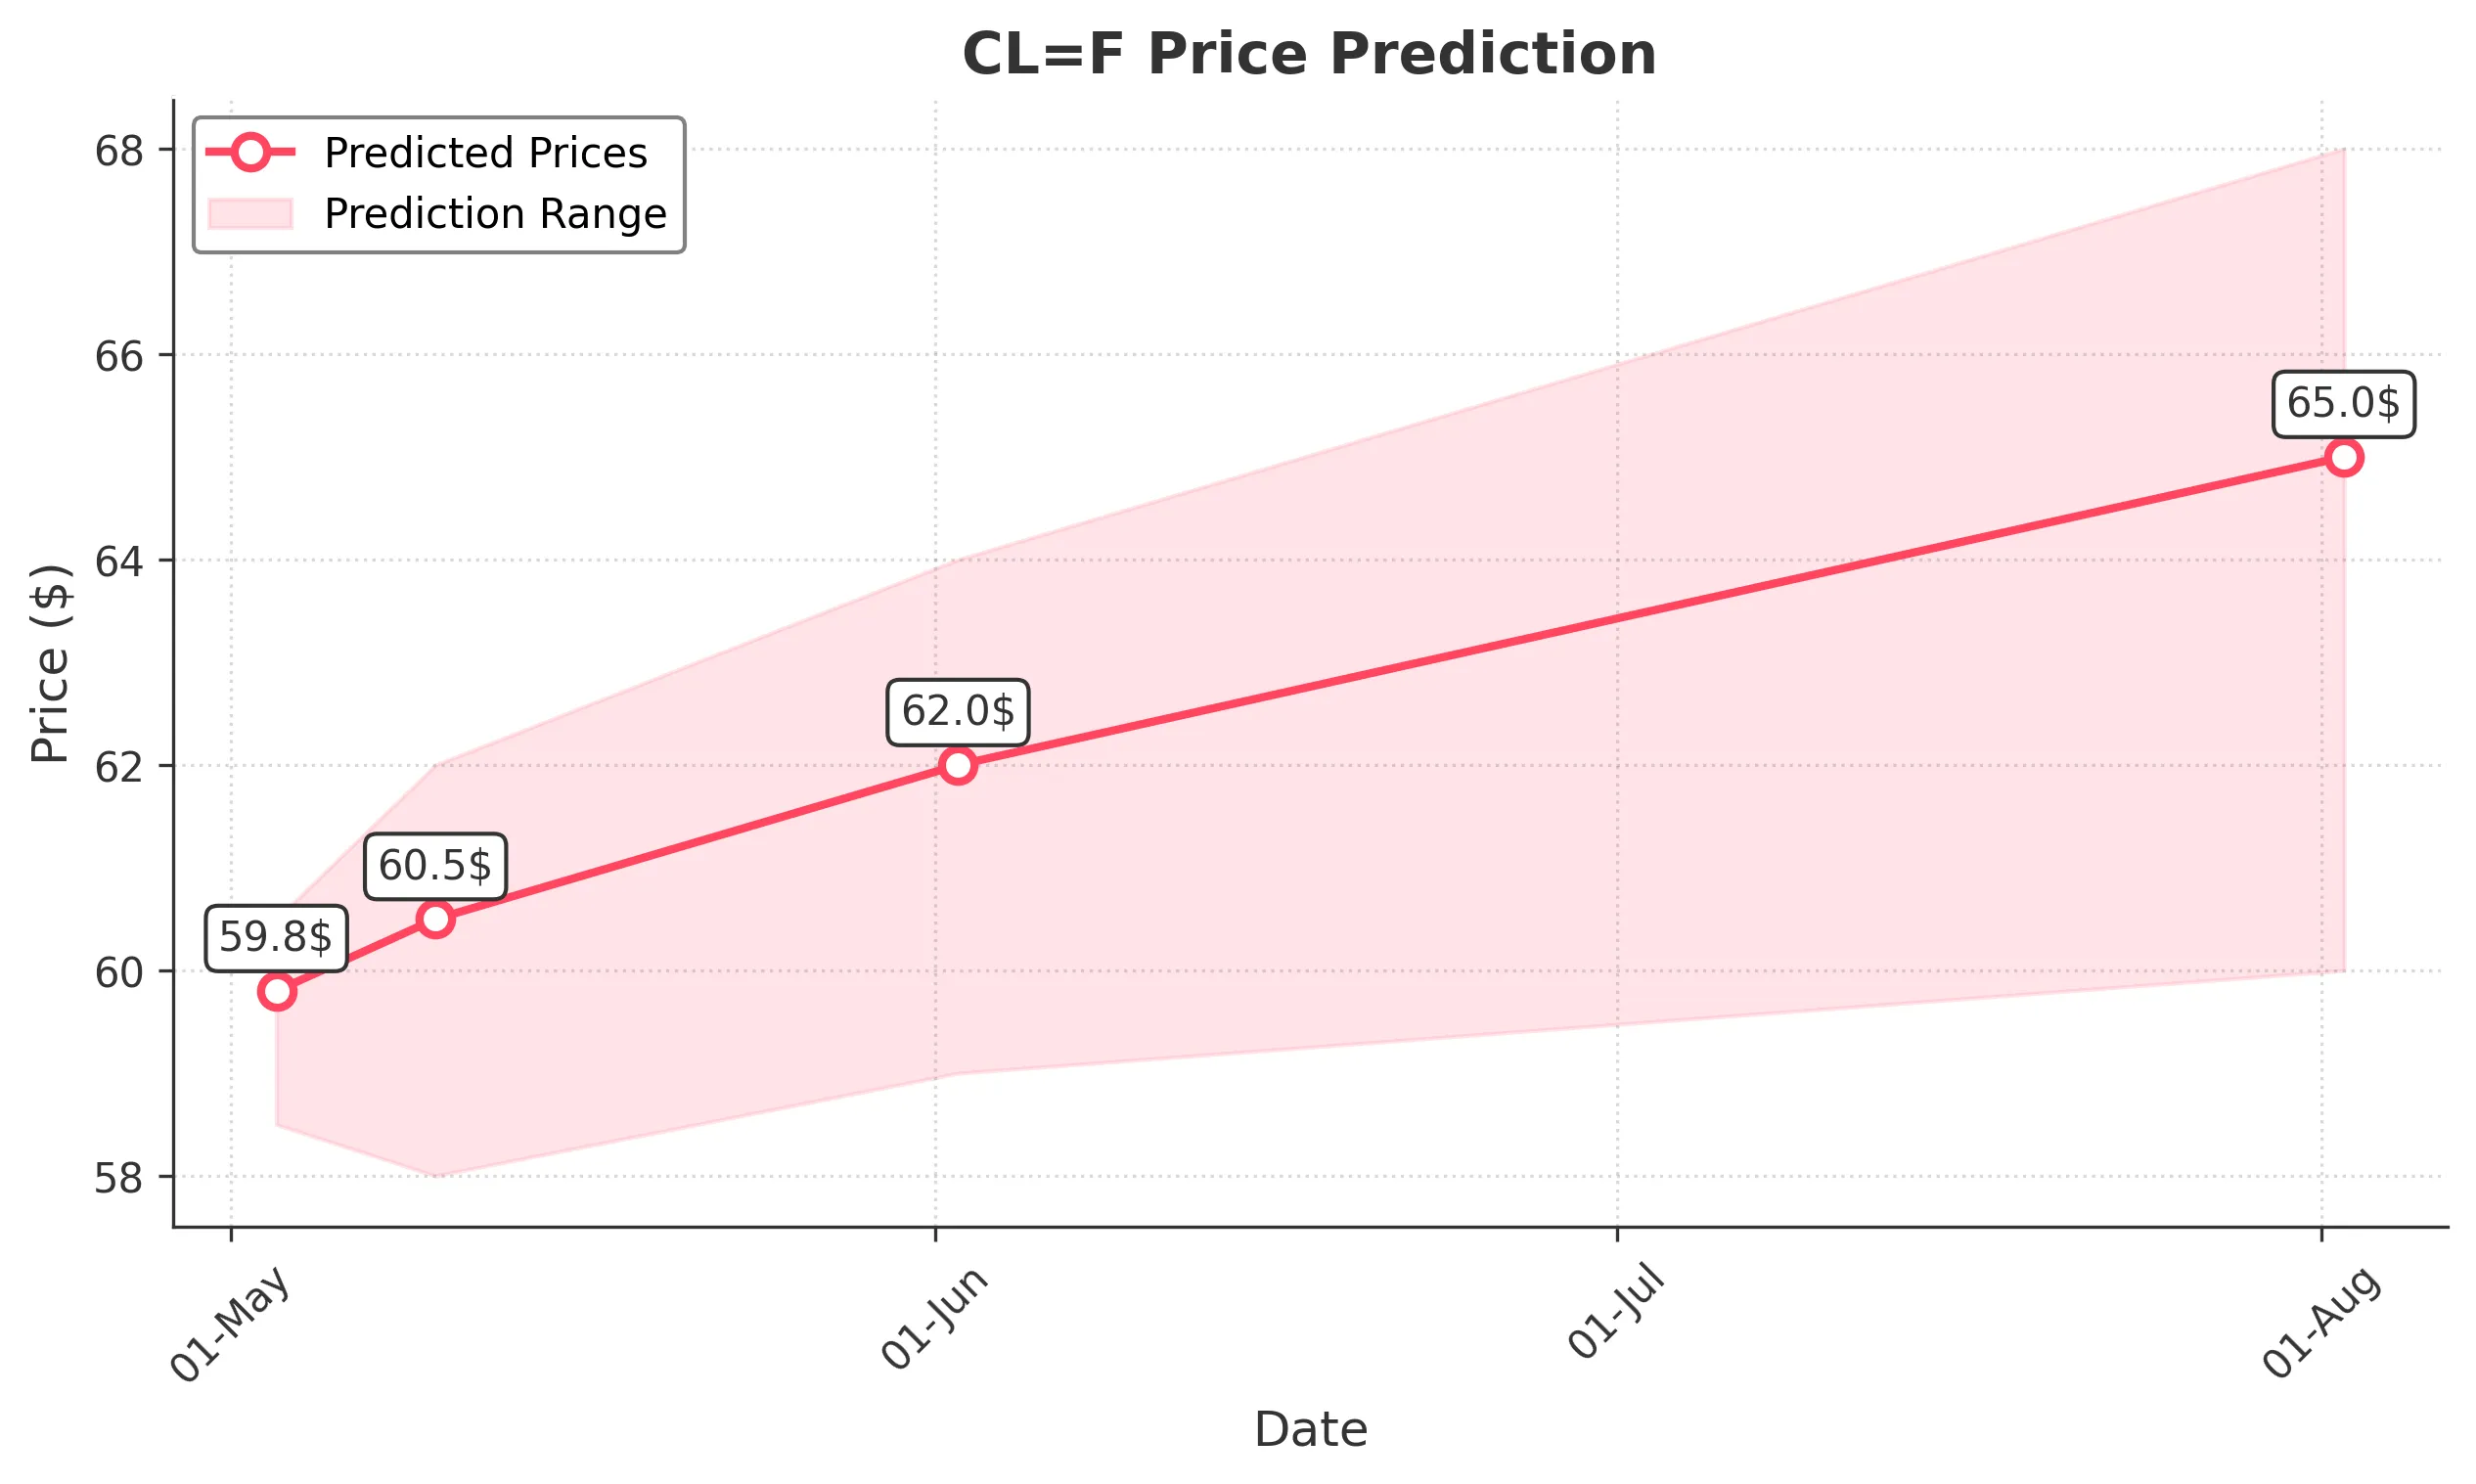
Target: May 3, 2025$59.8
$59.5
$60.5
$58.5
Description
The stock shows a slight bullish trend with a potential bounce from recent lows. RSI indicates oversold conditions, while MACD is showing a bullish crossover. However, volatility remains high, suggesting caution.
Analysis
Over the past 3 months, CL=F has shown a bearish trend with significant volatility. Key support at $58.20 and resistance at $71.48. Recent candlestick patterns indicate indecision, and volume spikes suggest potential reversals.
Confidence Level
Potential Risks
Market sentiment could shift due to macroeconomic news or earnings reports, which may impact the prediction.
1 Week Prediction
Target: May 10, 2025$60.5
$59.8
$62
$58
Description
Expect a gradual recovery as the stock may find support around $58.00. The RSI is improving, and MACD shows potential bullish momentum. However, external factors could lead to fluctuations.
Analysis
The stock has been in a downtrend, with recent attempts to recover. Key resistance at $62.00 and support at $58.00. Volume analysis shows decreasing interest, indicating a cautious market sentiment.
Confidence Level
Potential Risks
Uncertainty in market conditions and potential economic data releases could affect price stability.
1 Month Prediction
Target: June 2, 2025$62
$60.5
$64
$59
Description
A potential bullish reversal is anticipated as the stock approaches key Fibonacci retracement levels. The MACD may confirm upward momentum, but watch for resistance at $64.00.
Analysis
The stock has shown signs of recovery, with key support at $58.20 and resistance at $64.00. Technical indicators suggest a possible bullish trend, but external factors may introduce risks.
Confidence Level
Potential Risks
Market volatility and economic indicators could lead to unexpected price movements.
3 Months Prediction
Target: August 2, 2025$65
$62
$68
$60
Description
If the bullish trend continues, the stock could reach $65.00, supported by improving market sentiment and technical indicators. However, macroeconomic factors may pose risks.
Analysis
The stock has been volatile, with a bearish trend recently. Key resistance at $68.00 and support at $60.00. Technical indicators show mixed signals, indicating potential for both upward and downward movements.
Confidence Level
Potential Risks
Long-term predictions are uncertain due to potential market corrections and economic shifts.