OIL Trading Predictions
1 Day Prediction
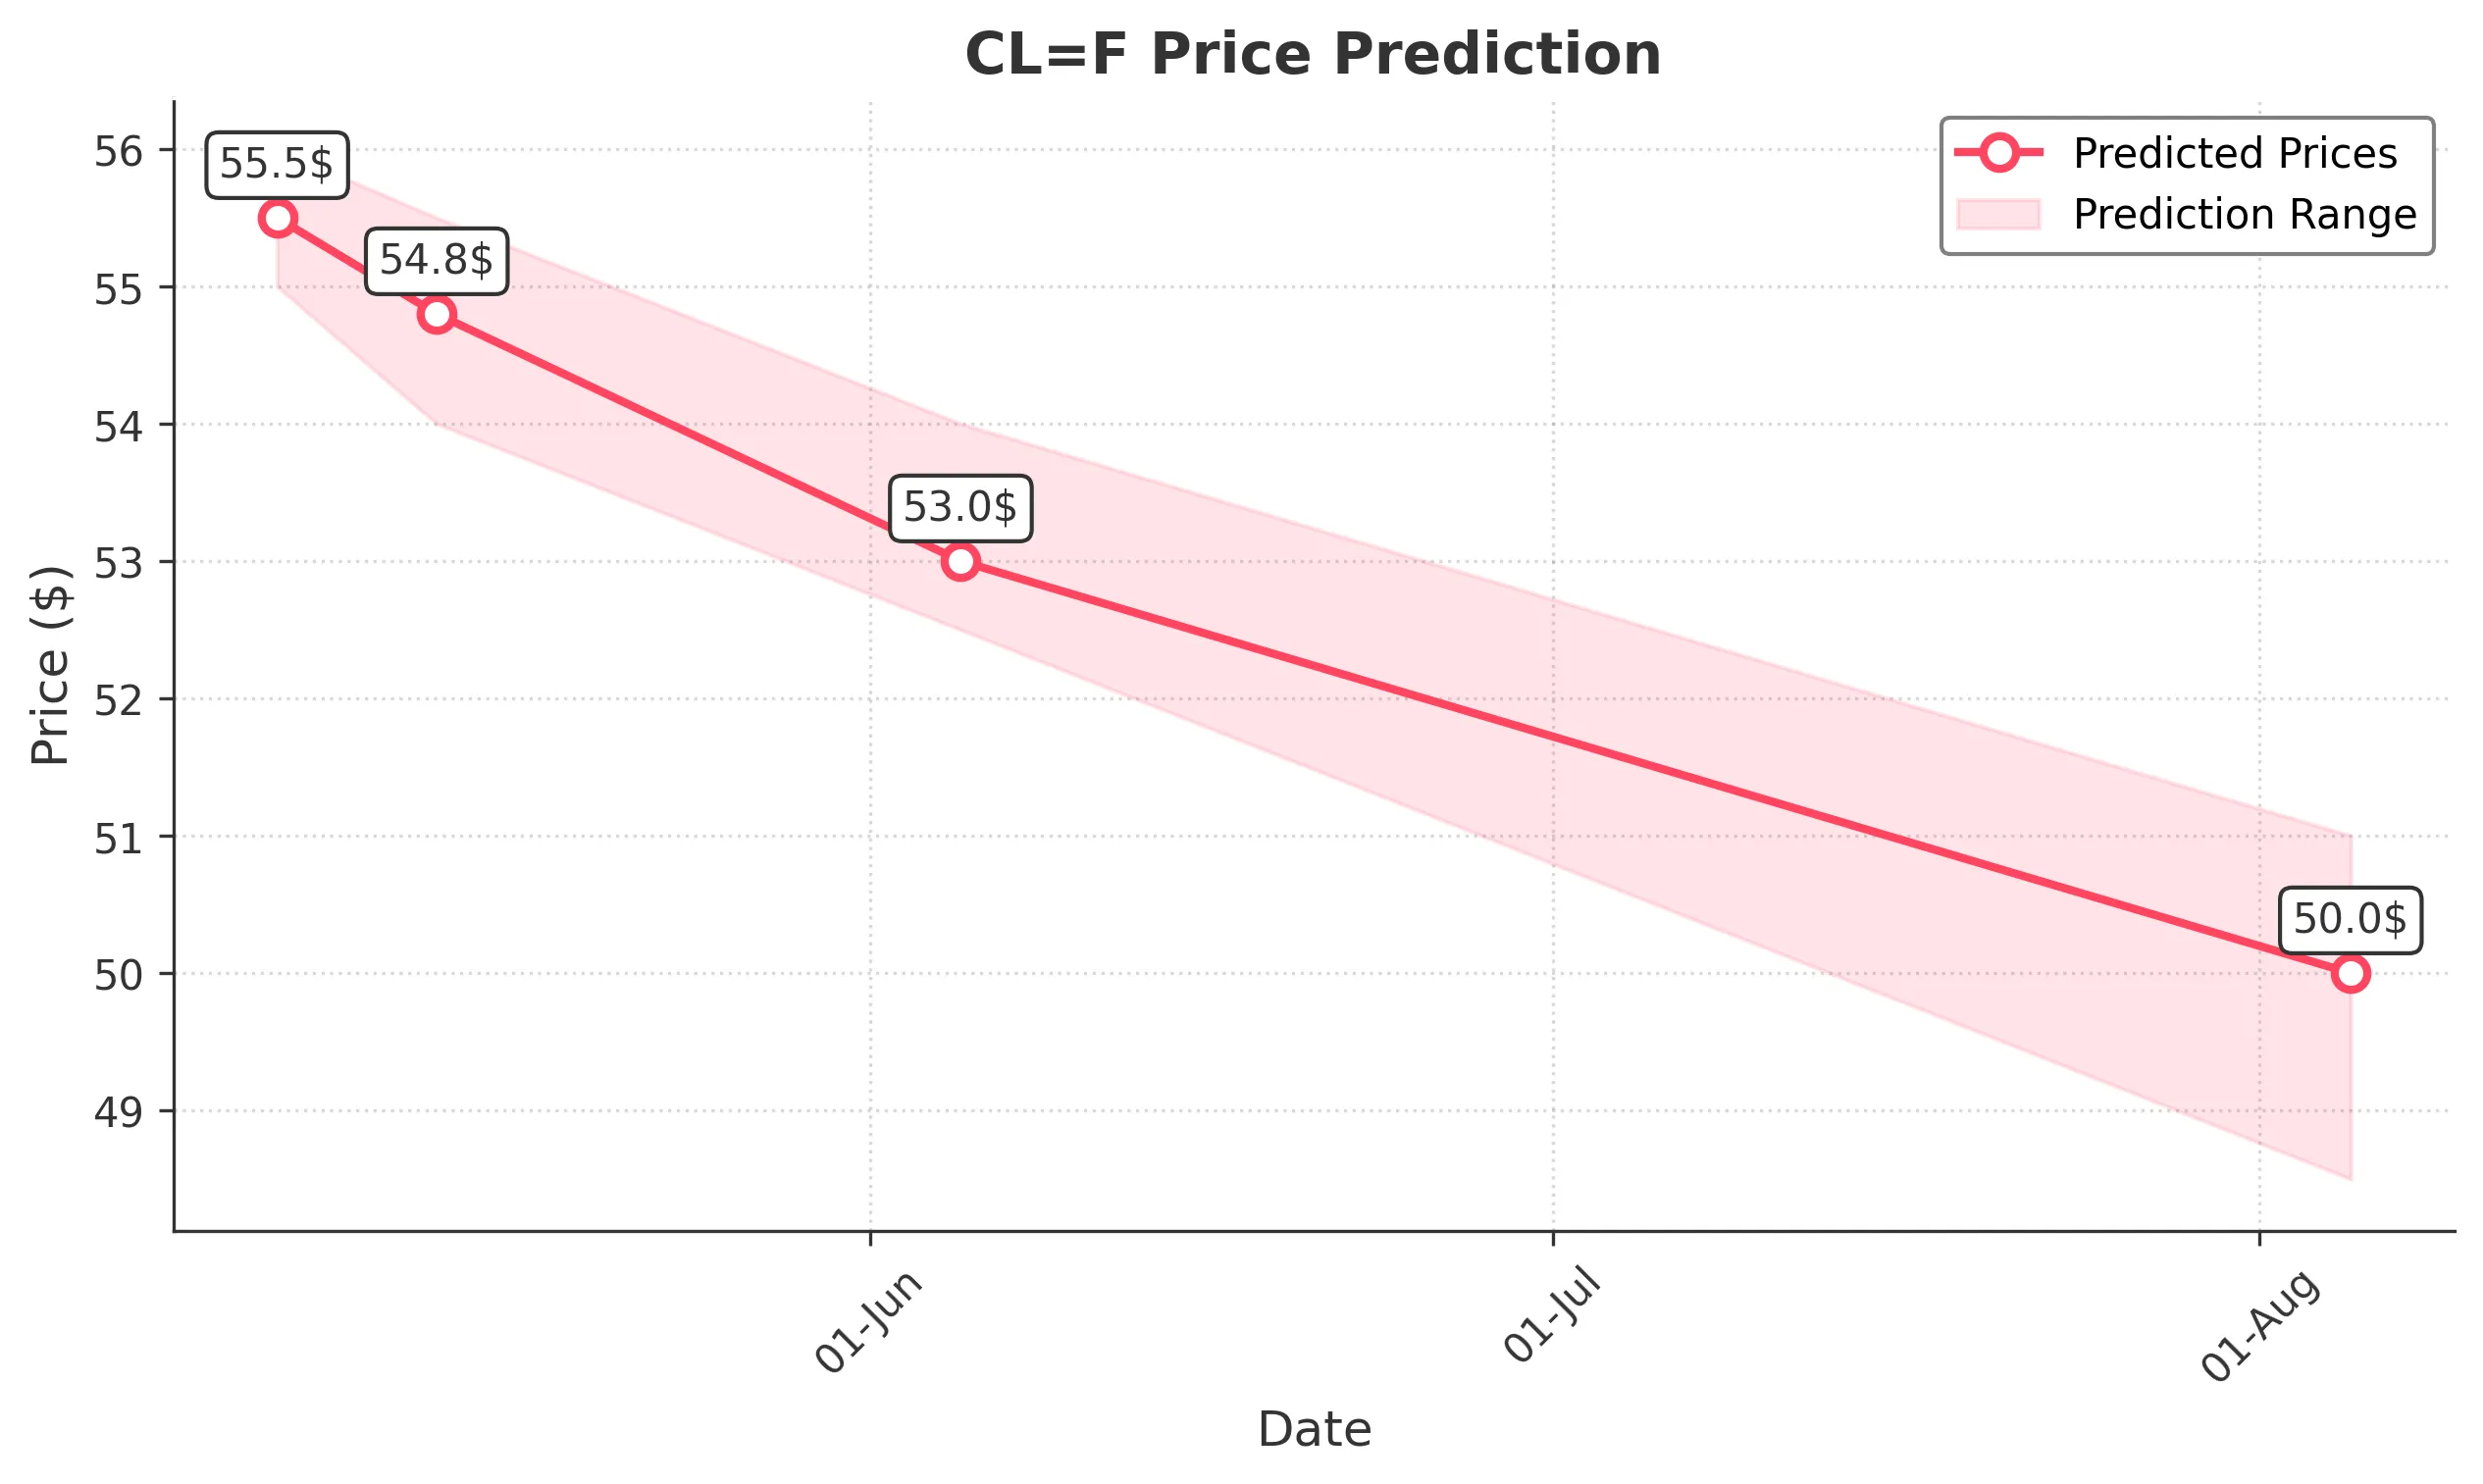
Target: May 6, 2025$55.5
$55.8
$56
$55
Description
The stock shows bearish momentum with a recent downtrend. The RSI indicates oversold conditions, but the MACD is negative. A potential bounce could occur, but overall sentiment remains weak.
Analysis
Over the past 3 months, CL=F has shown a bearish trend, with significant resistance around $66. Recent volume spikes indicate selling pressure. The stock is currently below key moving averages, suggesting continued weakness.
Confidence Level
Potential Risks
Market volatility and external news could impact the prediction. A sudden positive catalyst may reverse the trend.
1 Week Prediction
Target: May 13, 2025$54.8
$55.2
$55.5
$54
Description
The bearish trend is expected to continue, with potential for further declines. The Bollinger Bands indicate a squeeze, suggesting low volatility but possible downward movement.
Analysis
The stock has been in a downtrend, with support around $54. Technical indicators suggest continued weakness. Volume analysis shows increased selling, and the overall market sentiment is cautious.
Confidence Level
Potential Risks
Any unexpected market news or economic data could lead to volatility, impacting the accuracy of this prediction.
1 Month Prediction
Target: June 5, 2025$53
$54.5
$54
$52.5
Description
The stock is likely to continue its downward trajectory, with bearish patterns forming. The Fibonacci retracement levels suggest potential support at $52.50.
Analysis
CL=F has been under pressure, with key support levels being tested. The overall trend is bearish, and technical indicators support further declines. Volume patterns indicate persistent selling.
Confidence Level
Potential Risks
Market conditions can change rapidly, and any positive news could alter the bearish outlook significantly.
3 Months Prediction
Target: August 5, 2025$50
$51.5
$51
$48.5
Description
The stock is expected to decline further, with bearish sentiment prevailing. The MACD remains negative, and the RSI indicates continued oversold conditions.
Analysis
The stock has shown a consistent downtrend over the past months, with significant resistance levels. Technical indicators suggest a bearish outlook, and macroeconomic factors may further impact performance.
Confidence Level
Potential Risks
Long-term predictions are uncertain due to potential market shifts and economic changes that could influence prices.