OIL Trading Predictions
1 Day Prediction
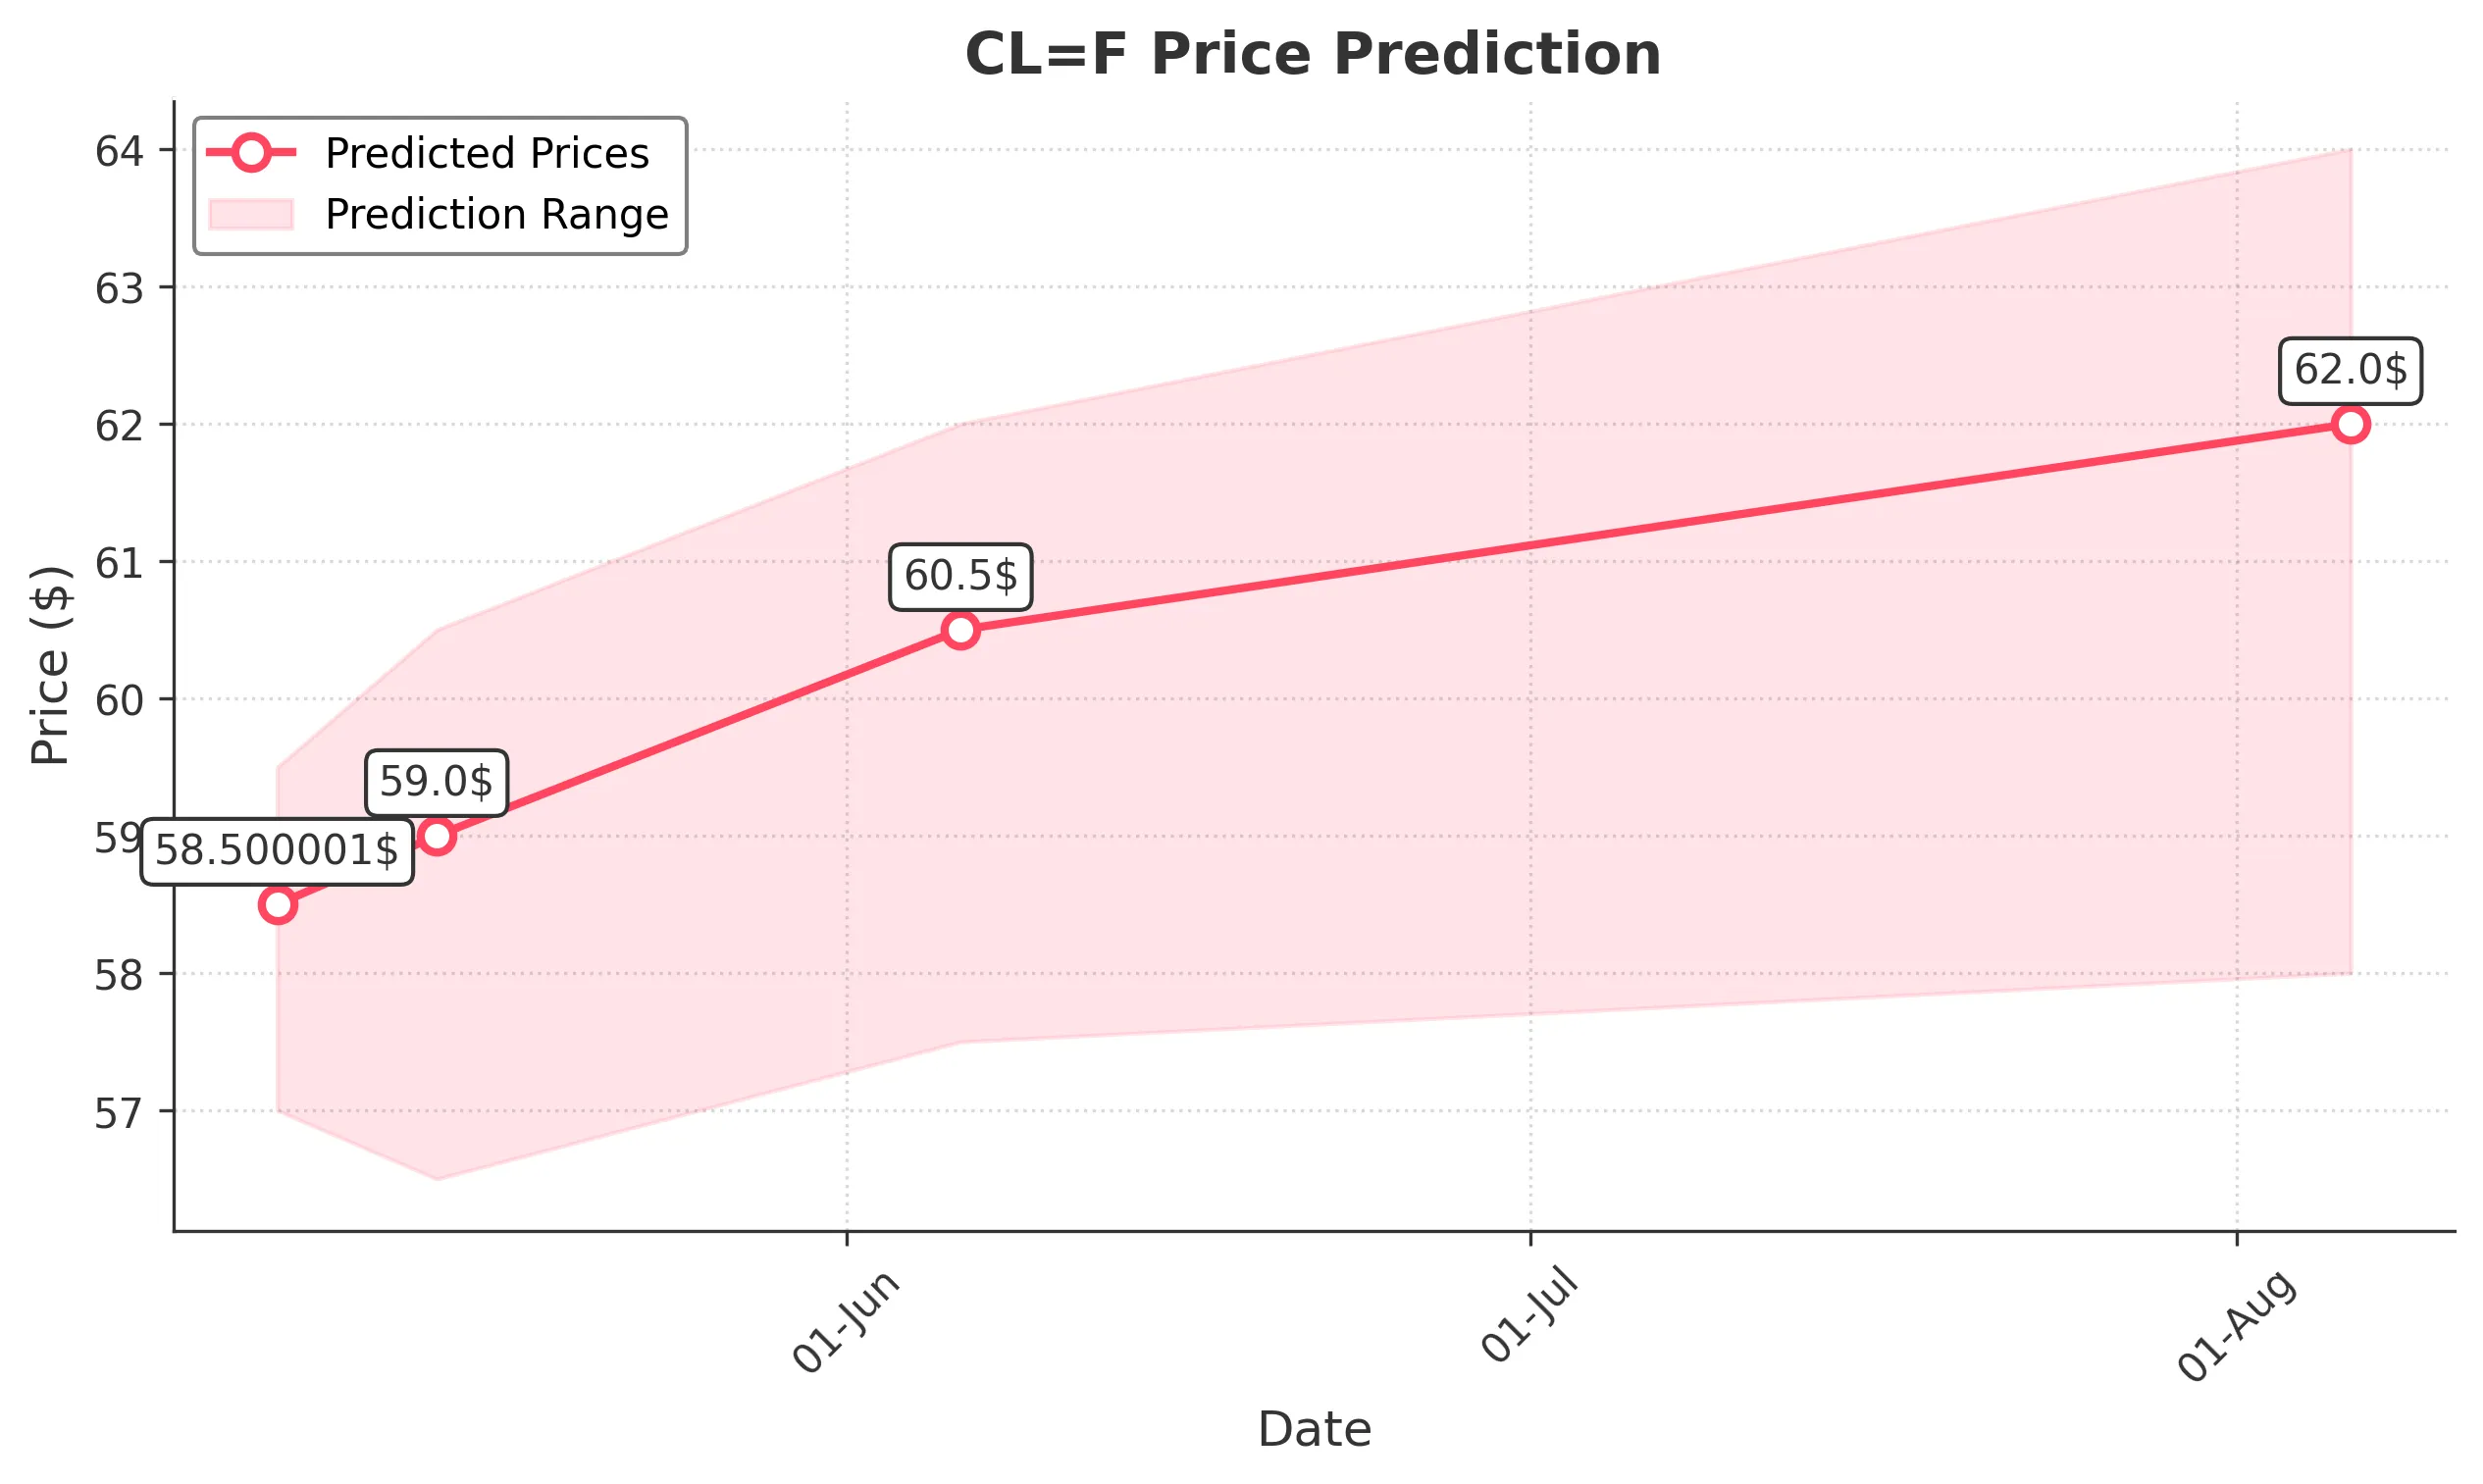
Target: May 7, 2025$58.500001
$58.060001
$59.5
$57
Description
The stock shows a slight bullish trend with a potential close around 58.50. The RSI is neutral, and MACD indicates a potential upward momentum. However, recent volatility suggests caution.
Analysis
Over the past 3 months, CL=F has shown a bearish trend with significant volatility. Key support at 57.00 and resistance at 62.00. Recent candlestick patterns indicate indecision, and volume has been inconsistent.
Confidence Level
Potential Risks
Market sentiment could shift due to external news or economic data releases, impacting the prediction.
1 Week Prediction
Target: May 14, 2025$59
$58.500001
$60.5
$56.5
Description
Expecting a slight recovery to 59.00 as the stock may bounce off support levels. The Bollinger Bands suggest potential upward movement, but caution is advised due to recent bearish trends.
Analysis
The stock has been in a downtrend, with significant resistance at 62.00. Volume spikes indicate selling pressure, and the ATR suggests high volatility. Recent candlestick patterns show indecision.
Confidence Level
Potential Risks
Potential for further declines if market sentiment worsens or if economic indicators are unfavorable.
1 Month Prediction
Target: June 6, 2025$60.5
$59
$62
$57.5
Description
A gradual recovery to 60.50 is anticipated as the stock may stabilize. The MACD shows signs of bullish divergence, but external factors could impact this trend.
Analysis
CL=F has faced downward pressure, with key support at 57.00. The RSI indicates oversold conditions, suggesting a potential rebound. However, the overall trend remains bearish.
Confidence Level
Potential Risks
Economic conditions and geopolitical events could lead to unexpected volatility, affecting the stock's performance.
3 Months Prediction
Target: August 6, 2025$62
$60.5
$64
$58
Description
A potential recovery to 62.00 is expected as the market stabilizes. The Fibonacci retracement levels suggest a bounce back, but caution is warranted due to market volatility.
Analysis
The stock has been volatile, with significant resistance at 64.00. Recent patterns indicate a possible reversal, but the overall trend remains bearish. Volume analysis shows mixed signals.
Confidence Level
Potential Risks
Long-term predictions are uncertain due to potential economic shifts and market sentiment changes.