OIL Trading Predictions
1 Day Prediction
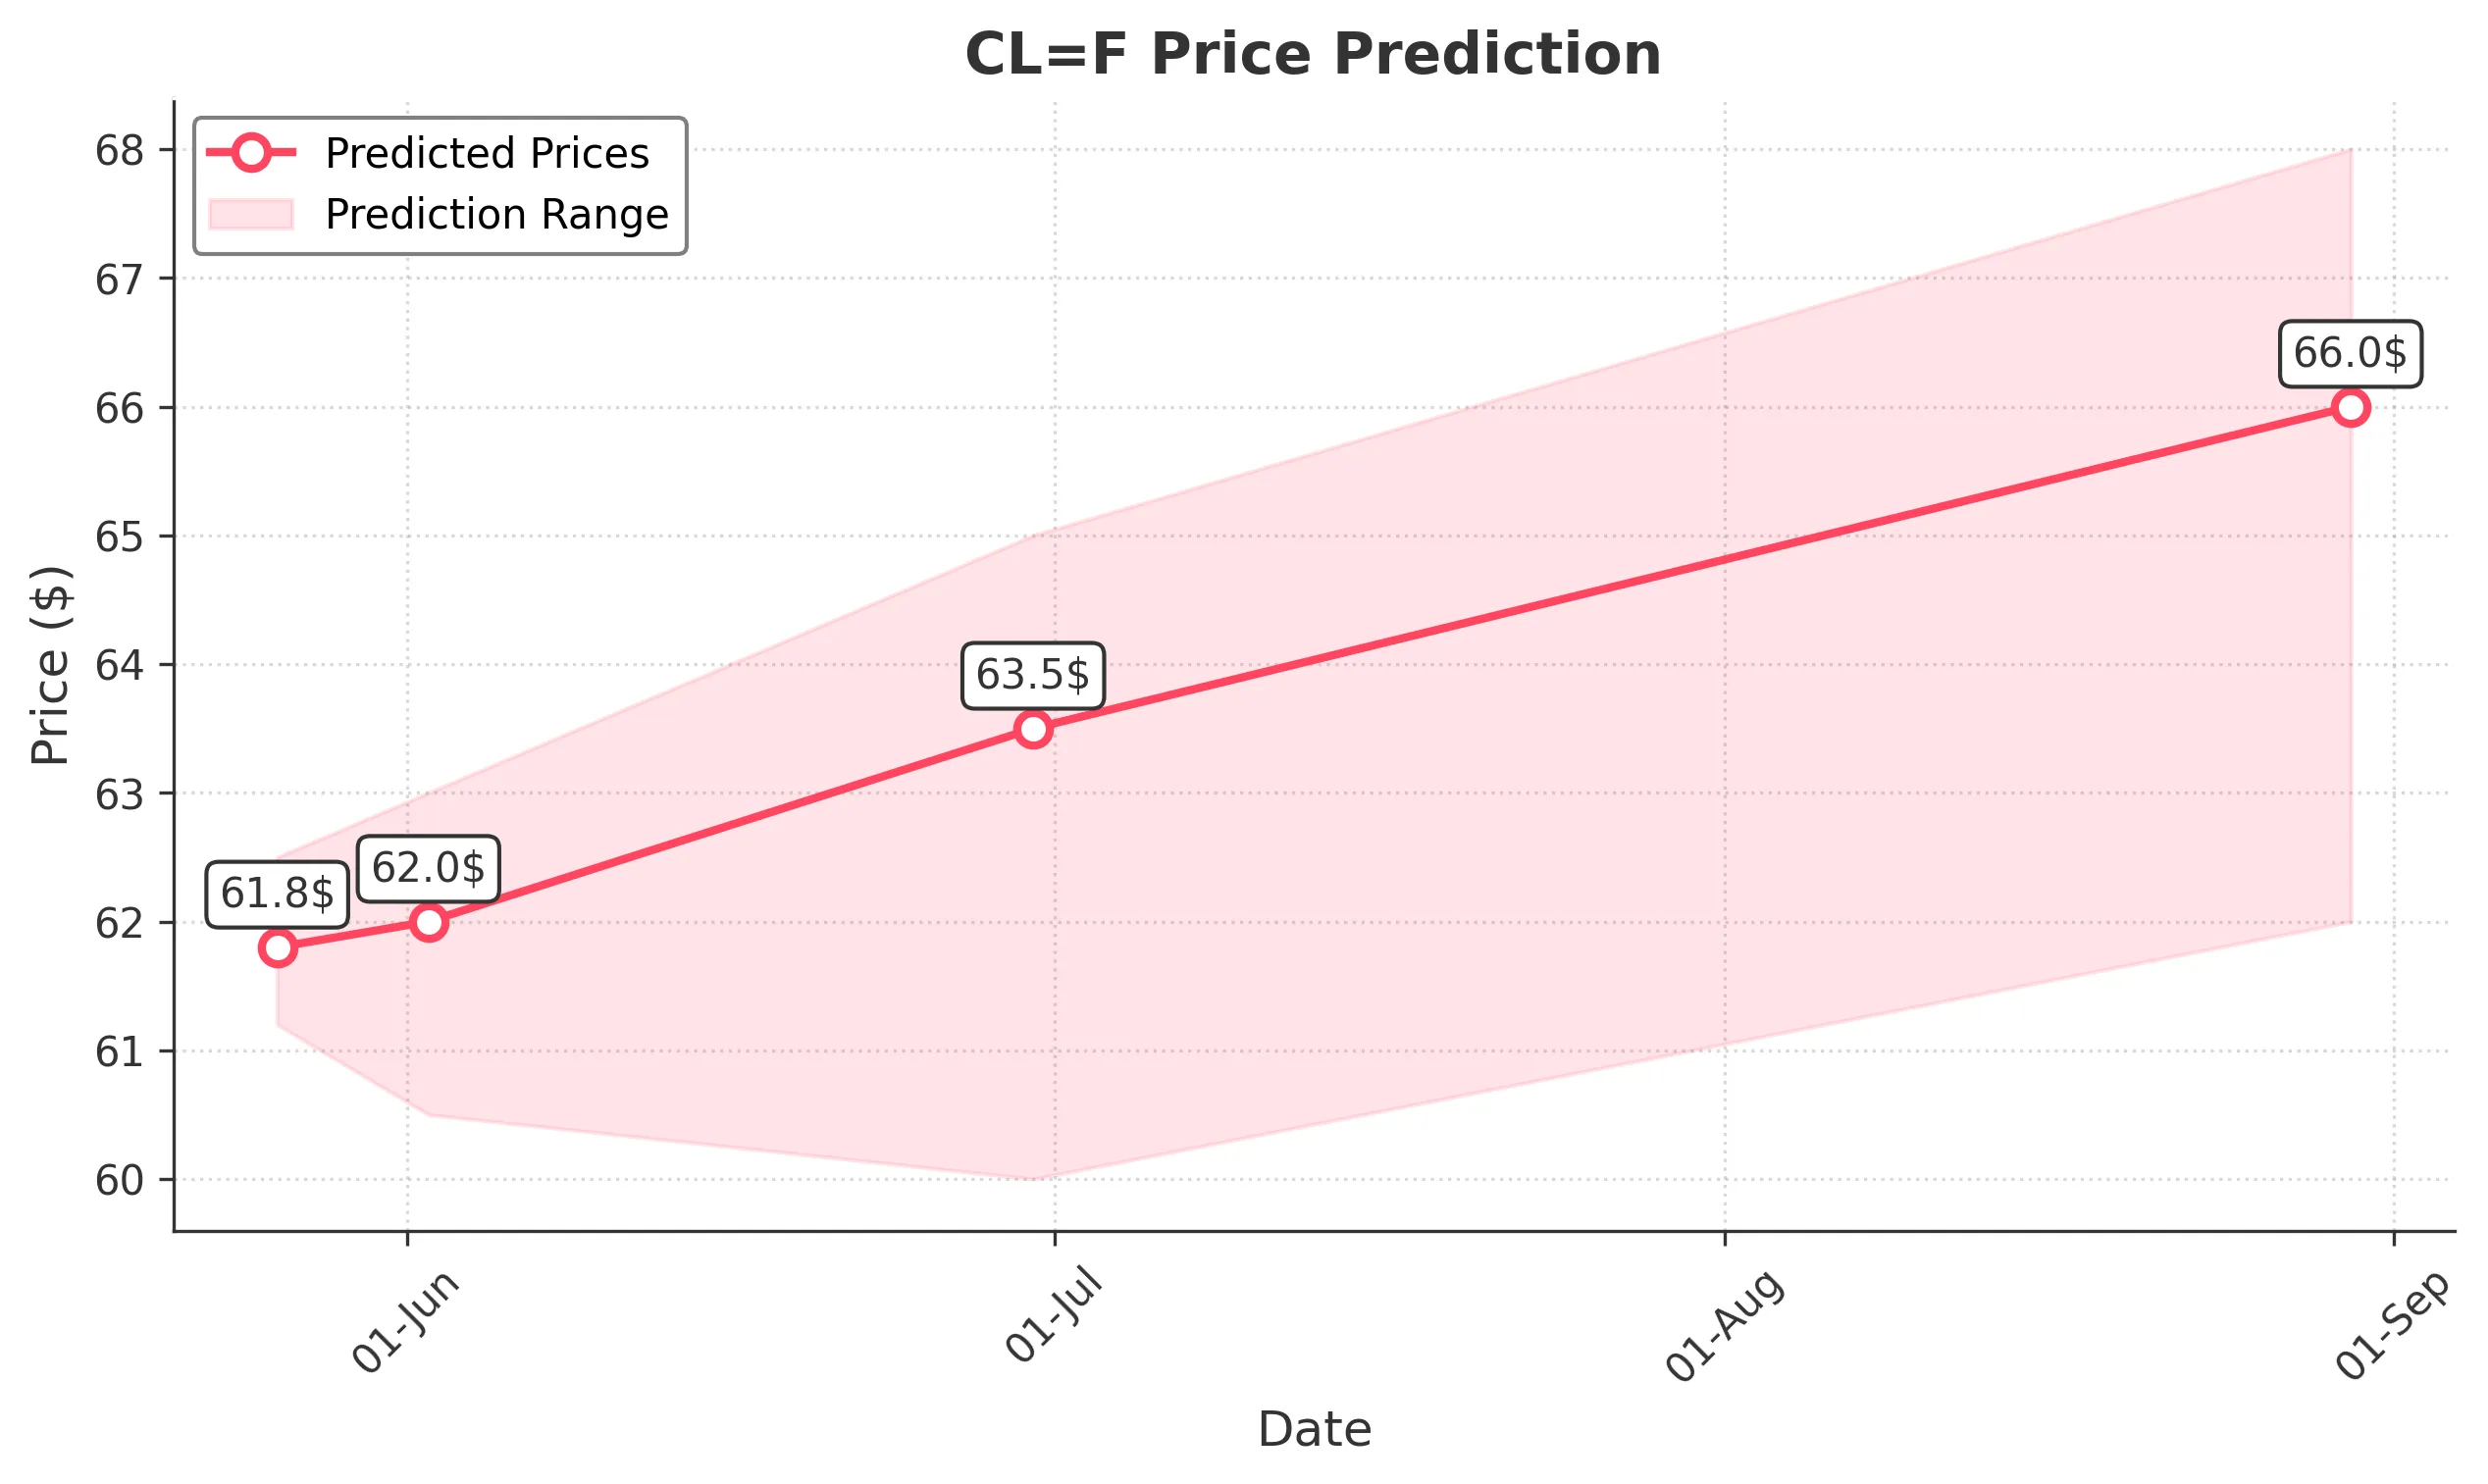
Target: May 26, 2025$61.8
$61.5
$62.5
$61.2
Description
The stock shows a slight bullish trend with a potential close around 61.80. The RSI is neutral, and MACD indicates a potential upward momentum. However, recent volatility suggests caution.
Analysis
Over the past 3 months, CL=F has shown a bearish trend with significant volatility. Key support at 58.20 and resistance at 71.48. Recent candlestick patterns indicate indecision, and volume has been inconsistent, suggesting uncertainty.
Confidence Level
Potential Risks
Market sentiment could shift due to external factors, and recent price fluctuations may lead to unexpected movements.
1 Week Prediction
Target: June 2, 2025$62
$61.8
$63
$60.5
Description
Expecting a close around 62.00 as the stock may stabilize after recent declines. The Bollinger Bands suggest a potential breakout, but caution is advised due to market volatility.
Analysis
The stock has been in a bearish phase, with significant resistance at 63.00. The ATR indicates high volatility, and recent volume spikes suggest traders are reacting to news. The overall trend remains uncertain.
Confidence Level
Potential Risks
Potential for further declines exists if market sentiment worsens or if macroeconomic factors impact trading.
1 Month Prediction
Target: June 30, 2025$63.5
$62.5
$65
$60
Description
A potential recovery to 63.50 is anticipated as the stock may find support at lower levels. The MACD shows signs of bullish divergence, but external factors could impact this outlook.
Analysis
The stock has experienced significant fluctuations, with a bearish trend recently. Key support at 60.00 and resistance at 65.00. Volume analysis indicates mixed sentiment, and technical indicators suggest potential for recovery.
Confidence Level
Potential Risks
Unforeseen market events or economic data releases could lead to volatility, affecting the predicted price.
3 Months Prediction
Target: August 30, 2025$66
$64.5
$68
$62
Description
A gradual recovery to 66.00 is expected as the stock stabilizes. The RSI indicates potential for upward movement, but market conditions remain volatile.
Analysis
The stock has shown a bearish trend with high volatility. Key support at 62.00 and resistance at 68.00. Technical indicators suggest a possible recovery, but external factors could significantly impact performance.
Confidence Level
Potential Risks
Long-term predictions are uncertain due to potential economic shifts and market sentiment changes.