OIL Trading Predictions
1 Day Prediction
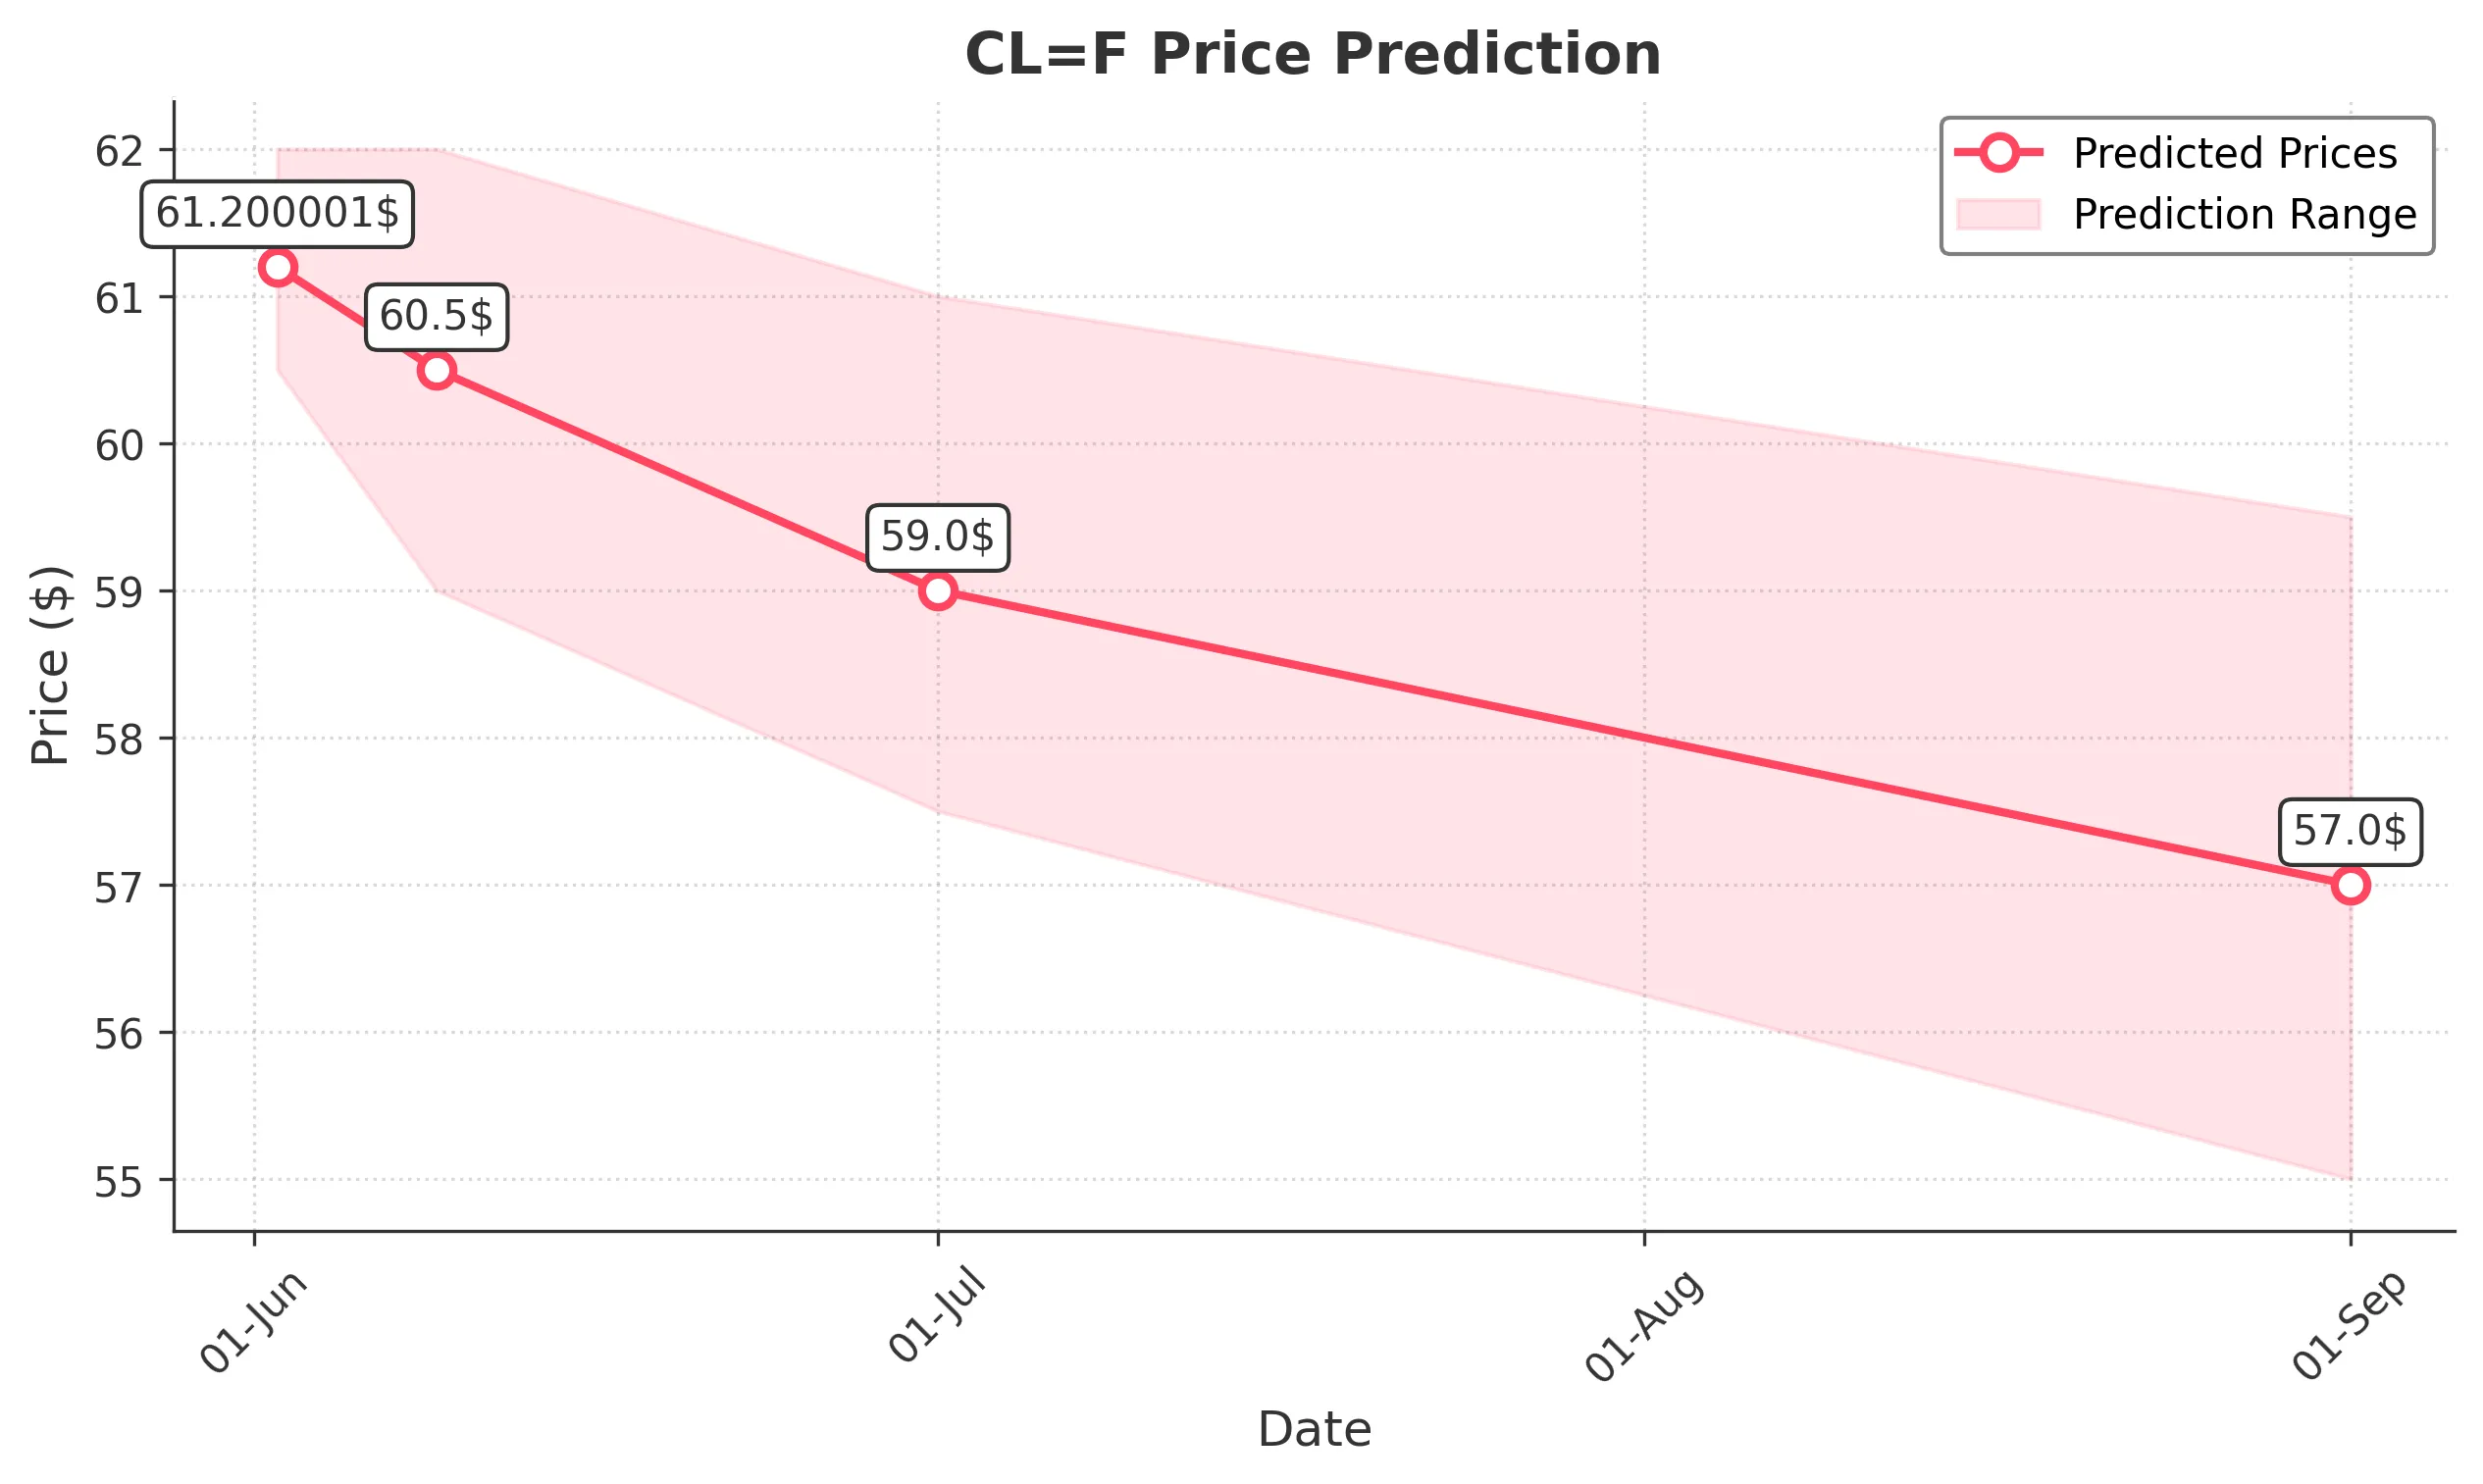
Target: June 2, 2025$61.200001
$61.75
$62
$60.5
Description
The stock shows a slight bullish trend with a recent close of 61.75. RSI indicates neutrality, while MACD is close to a bullish crossover. However, recent volatility suggests caution. Expect a range-bound movement.
Analysis
Over the past 3 months, CL=F has shown a bearish trend with significant volatility. Key support at 58.20 and resistance at 71.48. Recent candlestick patterns indicate indecision, and volume has been inconsistent, suggesting uncertainty.
Confidence Level
Potential Risks
Potential for sudden market shifts or external news could impact the prediction.
1 Week Prediction
Target: June 9, 2025$60.5
$61.200001
$62
$59
Description
Expect a slight decline as bearish sentiment prevails. The stock is facing resistance at 62.00, and the recent downtrend may continue. Volume spikes could indicate selling pressure.
Analysis
The stock has been in a bearish phase, with significant resistance at 62.00. Technical indicators show weakness, and volume patterns suggest selling pressure. The overall market sentiment remains cautious.
Confidence Level
Potential Risks
Market sentiment and macroeconomic factors could lead to unexpected price movements.
1 Month Prediction
Target: July 1, 2025$59
$60.5
$61
$57.5
Description
The stock is likely to continue its bearish trend, with potential support at 58.20. The RSI indicates oversold conditions, but without a strong reversal signal, further declines are expected.
Analysis
CL=F has faced significant downward pressure, with key support at 58.20. The recent bearish candlestick patterns and declining volume suggest a lack of buying interest. Market sentiment remains weak.
Confidence Level
Potential Risks
Unforeseen market events or changes in sentiment could alter the trajectory.
3 Months Prediction
Target: September 1, 2025$57
$59
$59.5
$55
Description
The stock may continue to decline, with potential for a bounce at lower levels. The overall trend remains bearish, and macroeconomic factors could further influence price action.
Analysis
The stock has been in a bearish trend, with significant resistance levels. Technical indicators suggest continued weakness, and volume patterns indicate a lack of buying support. External economic factors could further impact performance.
Confidence Level
Potential Risks
Long-term predictions are uncertain due to potential market volatility and external influences.