OIL Trading Predictions
1 Day Prediction
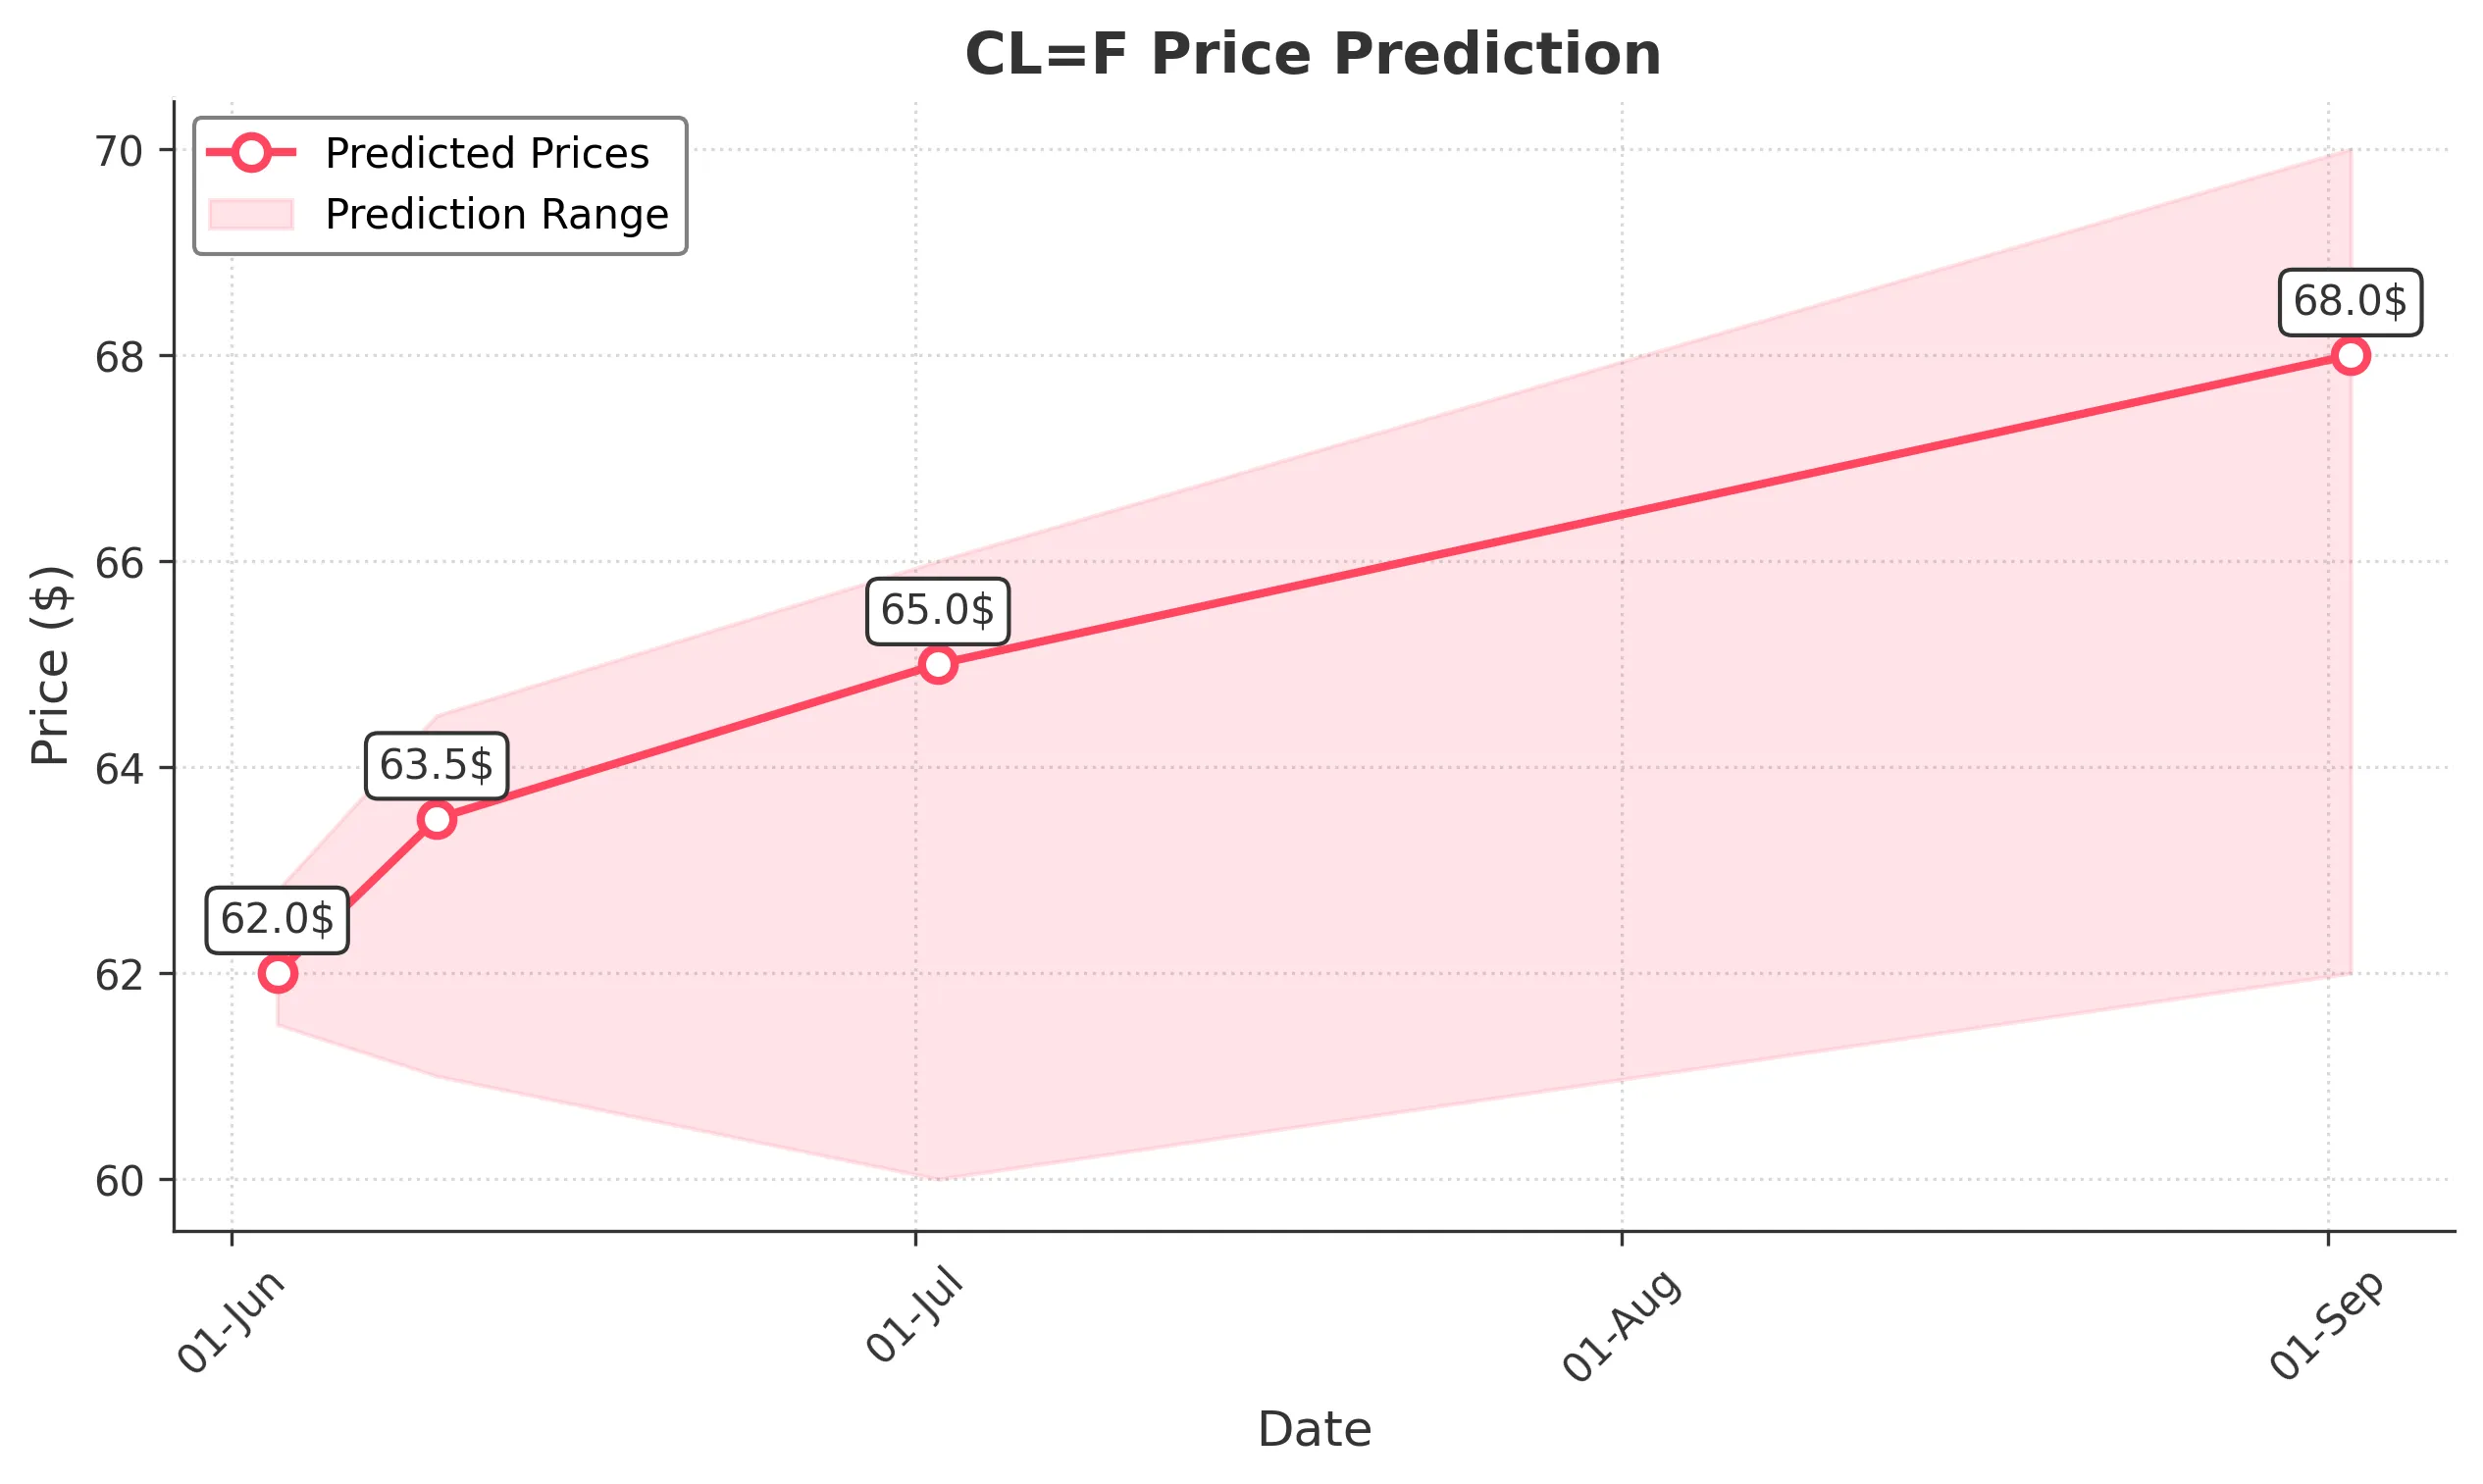
Target: June 3, 2025$62
$61.9
$62.8
$61.5
Description
The stock shows a slight bullish trend with a recent upward movement. The RSI is approaching overbought levels, indicating potential resistance. A Doji pattern suggests indecision, but overall sentiment remains cautiously optimistic.
Analysis
Over the past 3 months, CL=F has shown a bearish trend recently, with significant support around $60. The recent price action indicates a potential recovery, but the RSI and MACD suggest caution. Volume has been inconsistent, indicating uncertainty.
Confidence Level
Potential Risks
Market volatility and external news could impact the price. A reversal is possible if bearish sentiment increases.
1 Week Prediction
Target: June 10, 2025$63.5
$62
$64.5
$61
Description
A bullish reversal is anticipated as the stock approaches key Fibonacci retracement levels. The MACD shows a bullish crossover, and the volume is expected to increase, supporting upward momentum.
Analysis
The stock has been recovering from recent lows, with a bullish sentiment emerging. Key resistance levels are around $64, while support remains at $60. The MACD and RSI indicate a potential upward trend, but caution is warranted.
Confidence Level
Potential Risks
Potential market corrections or negative news could hinder upward movement. Watch for resistance at $64.
1 Month Prediction
Target: July 2, 2025$65
$63
$66
$60
Description
The stock is expected to continue its upward trajectory, supported by bullish technical indicators. The Bollinger Bands suggest potential for price expansion, while the RSI remains in a healthy range.
Analysis
CL=F has shown signs of recovery, with a bullish trend emerging. Key support at $60 and resistance at $66 are critical. The MACD and volume patterns suggest a potential upward move, but external factors could introduce risk.
Confidence Level
Potential Risks
Economic factors and market sentiment could lead to volatility. A failure to break above $66 may trigger a pullback.
3 Months Prediction
Target: September 2, 2025$68
$66.5
$70
$62
Description
Long-term bullish sentiment is expected as the stock approaches key resistance levels. The overall trend is supported by positive macroeconomic indicators, but caution is advised due to potential market corrections.
Analysis
The stock has shown a recovery trend, with key support at $60 and resistance at $70. Technical indicators suggest a bullish outlook, but external factors could introduce volatility. A balanced view is necessary as market conditions evolve.
Confidence Level
Potential Risks
Unforeseen economic events or geopolitical tensions could impact the stock's performance. Watch for signs of reversal.