OIL Trading Predictions
1 Day Prediction
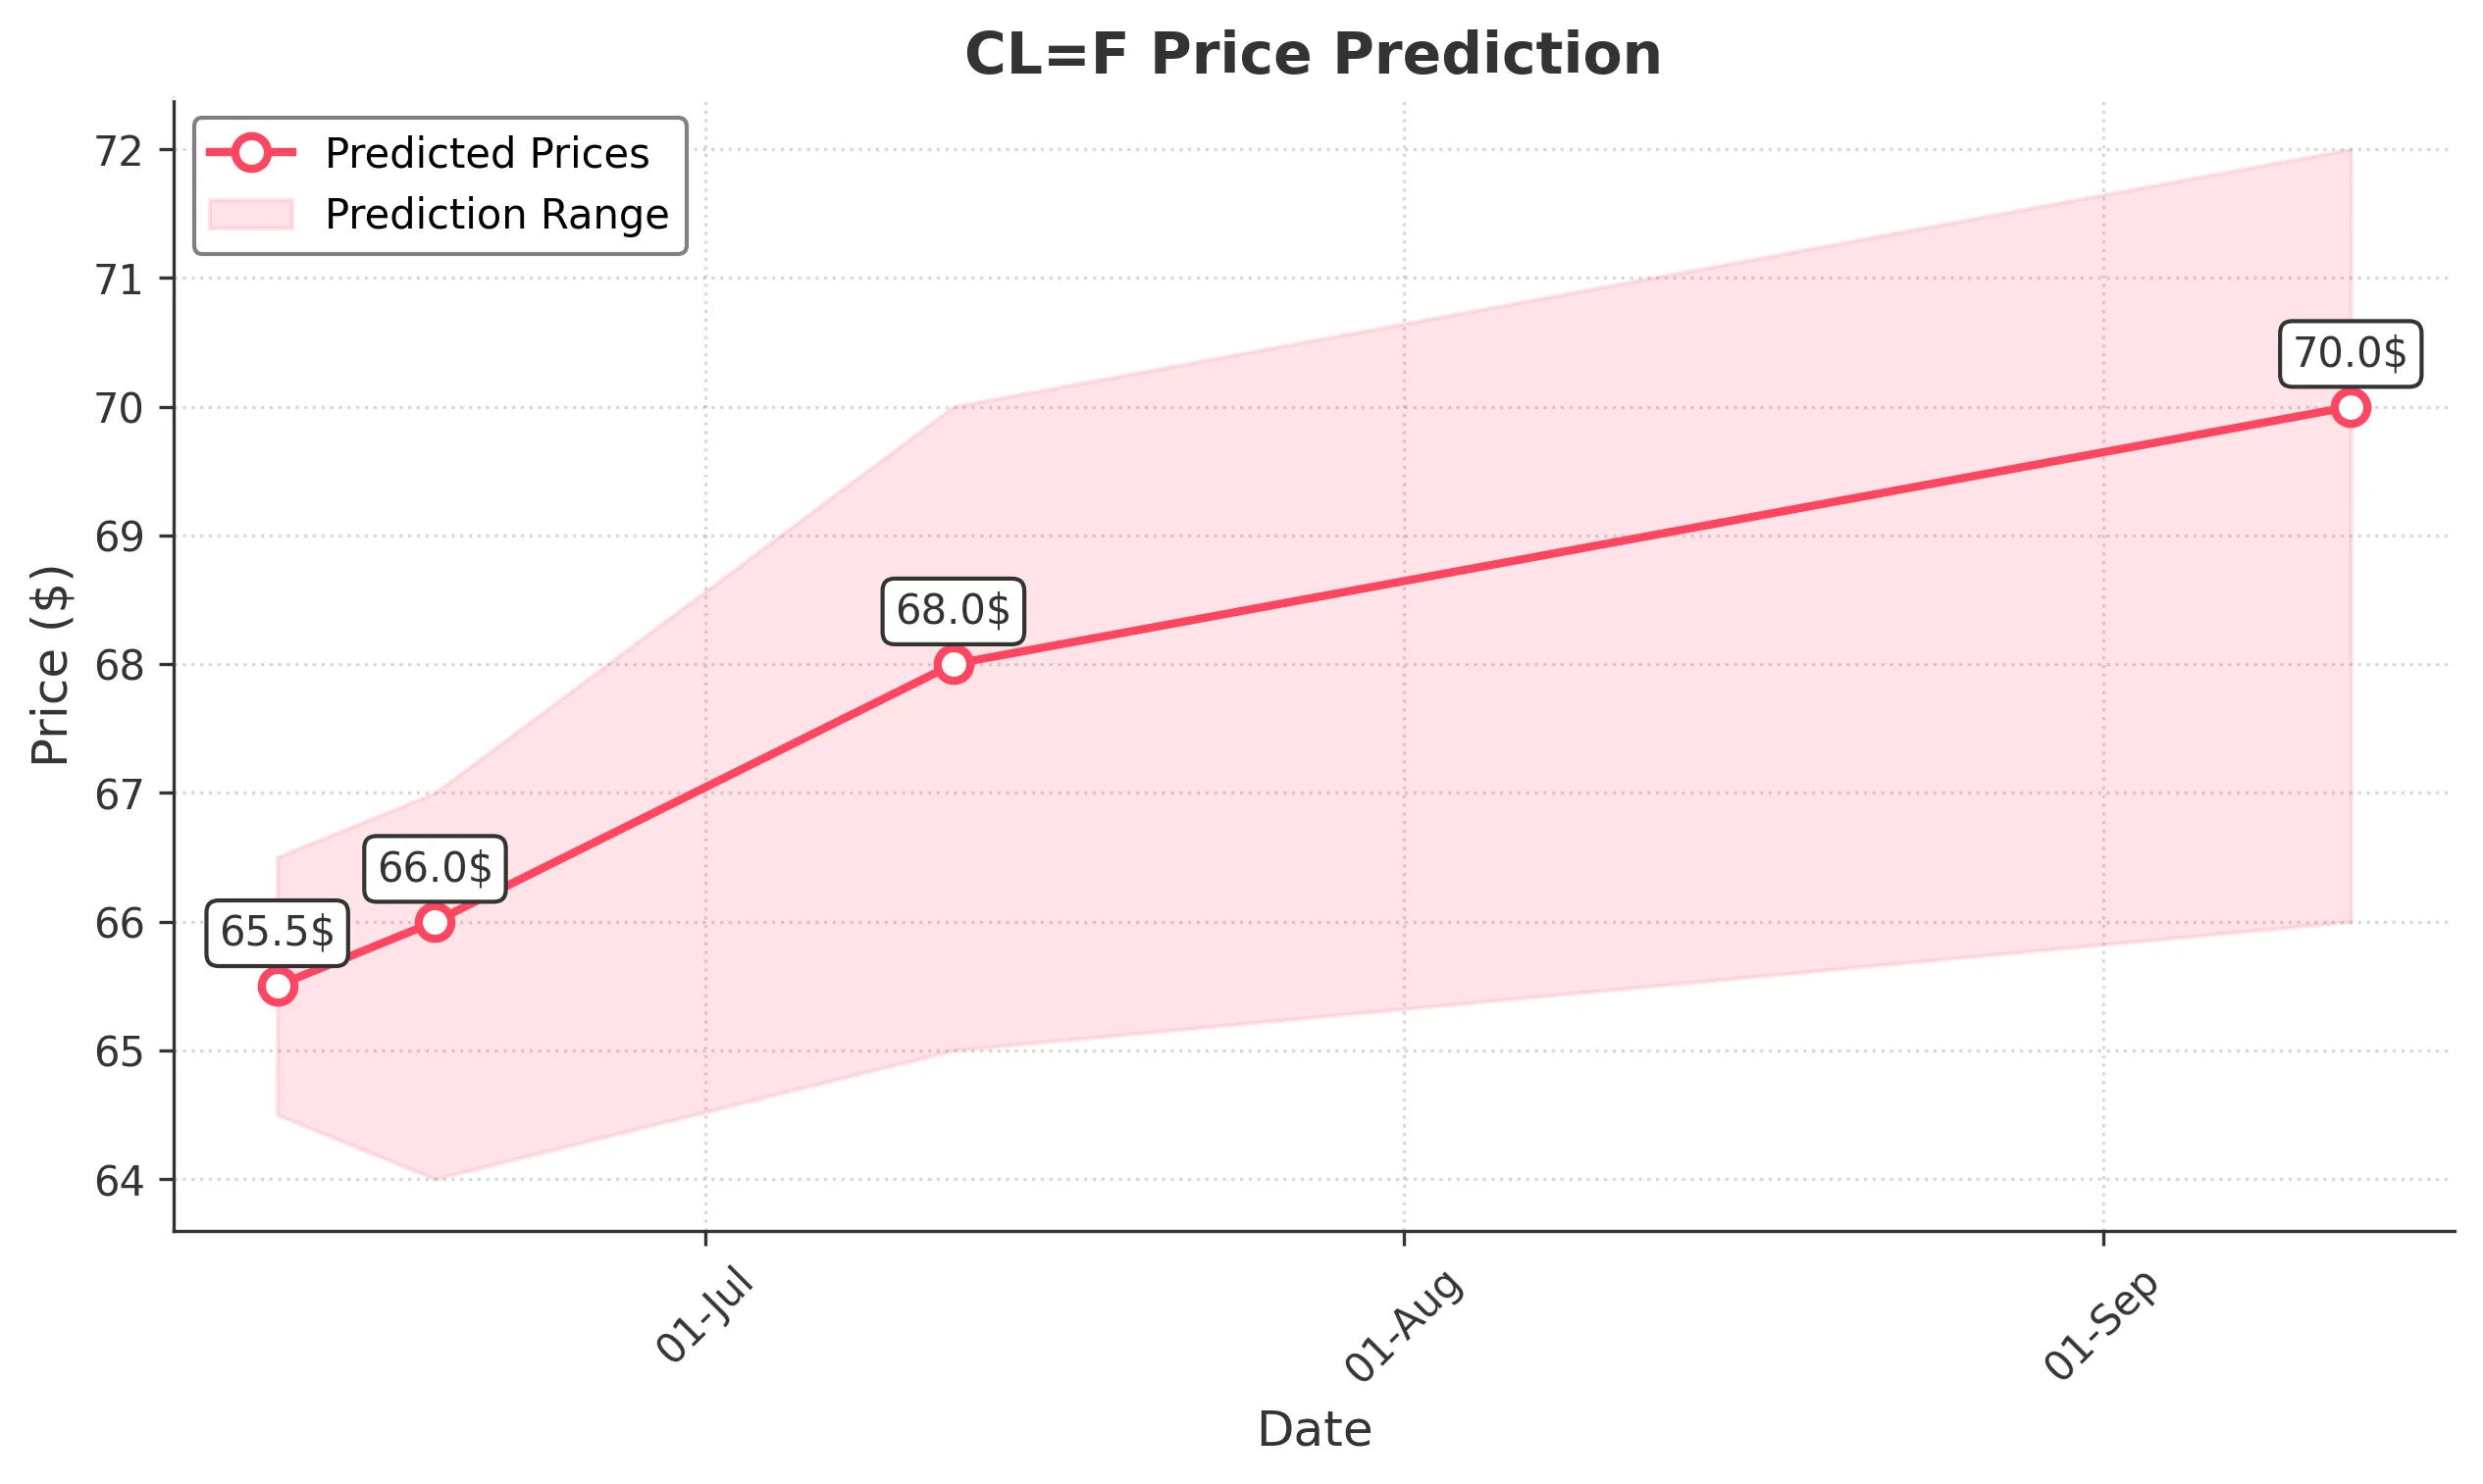
Target: June 12, 2025$65.5
$65
$66.5
$64.5
Description
The stock shows a slight bullish trend with a recent upward movement. The RSI is near 60, indicating potential for further gains. However, the MACD is flattening, suggesting caution. A Doji candlestick pattern indicates indecision, which could lead to volatility.
Analysis
Over the past 3 months, CL=F has shown a bullish trend with significant resistance around $66. The recent drop to $64.94 indicates potential bearish pressure. The MACD is showing signs of convergence, while the RSI suggests overbought conditions. Volume has been inconsistent, indicating uncertainty.
Confidence Level
Potential Risks
Market sentiment could shift quickly due to external news or economic data releases, impacting the prediction.
1 Week Prediction
Target: June 19, 2025$66
$65.5
$67
$64
Description
The stock is expected to stabilize around $66 as it approaches resistance. The Bollinger Bands are tightening, indicating potential for a breakout. However, the recent bearish candlestick patterns suggest caution, and a pullback could occur.
Analysis
The stock has been fluctuating between $64 and $67, with key support at $64. The RSI is approaching neutral, indicating a possible consolidation phase. Volume spikes have been observed, suggesting increased interest but also uncertainty in direction.
Confidence Level
Potential Risks
Potential for market volatility due to macroeconomic events or earnings reports could affect the accuracy of this prediction.
1 Month Prediction
Target: July 12, 2025$68
$66.5
$70
$65
Description
A bullish outlook is anticipated as the stock may break through resistance levels. The MACD is showing a bullish crossover, and the RSI is recovering. However, external factors could lead to volatility, so caution is advised.
Analysis
The stock has shown resilience with a recent upward trend. Key resistance at $67 has been tested multiple times. The ATR indicates increasing volatility, and the volume suggests strong interest. The overall sentiment remains cautiously optimistic.
Confidence Level
Potential Risks
Economic indicators or geopolitical events could impact market sentiment and lead to unexpected price movements.
3 Months Prediction
Target: September 12, 2025$70
$68
$72
$66
Description
Long-term bullish sentiment is expected as the stock may continue to rise towards $70. The Fibonacci retracement levels suggest strong support at $66. However, market corrections are possible, and external factors could influence this trend.
Analysis
The stock has been on a bullish trajectory, with key support at $66 and resistance at $70. The MACD indicates a strong upward momentum, while the RSI suggests potential overbought conditions. Volume trends indicate sustained interest, but caution is warranted due to potential market fluctuations.
Confidence Level
Potential Risks
Unforeseen market events or economic downturns could lead to a reversal in trend, impacting the prediction.