OIL Trading Predictions
1 Day Prediction
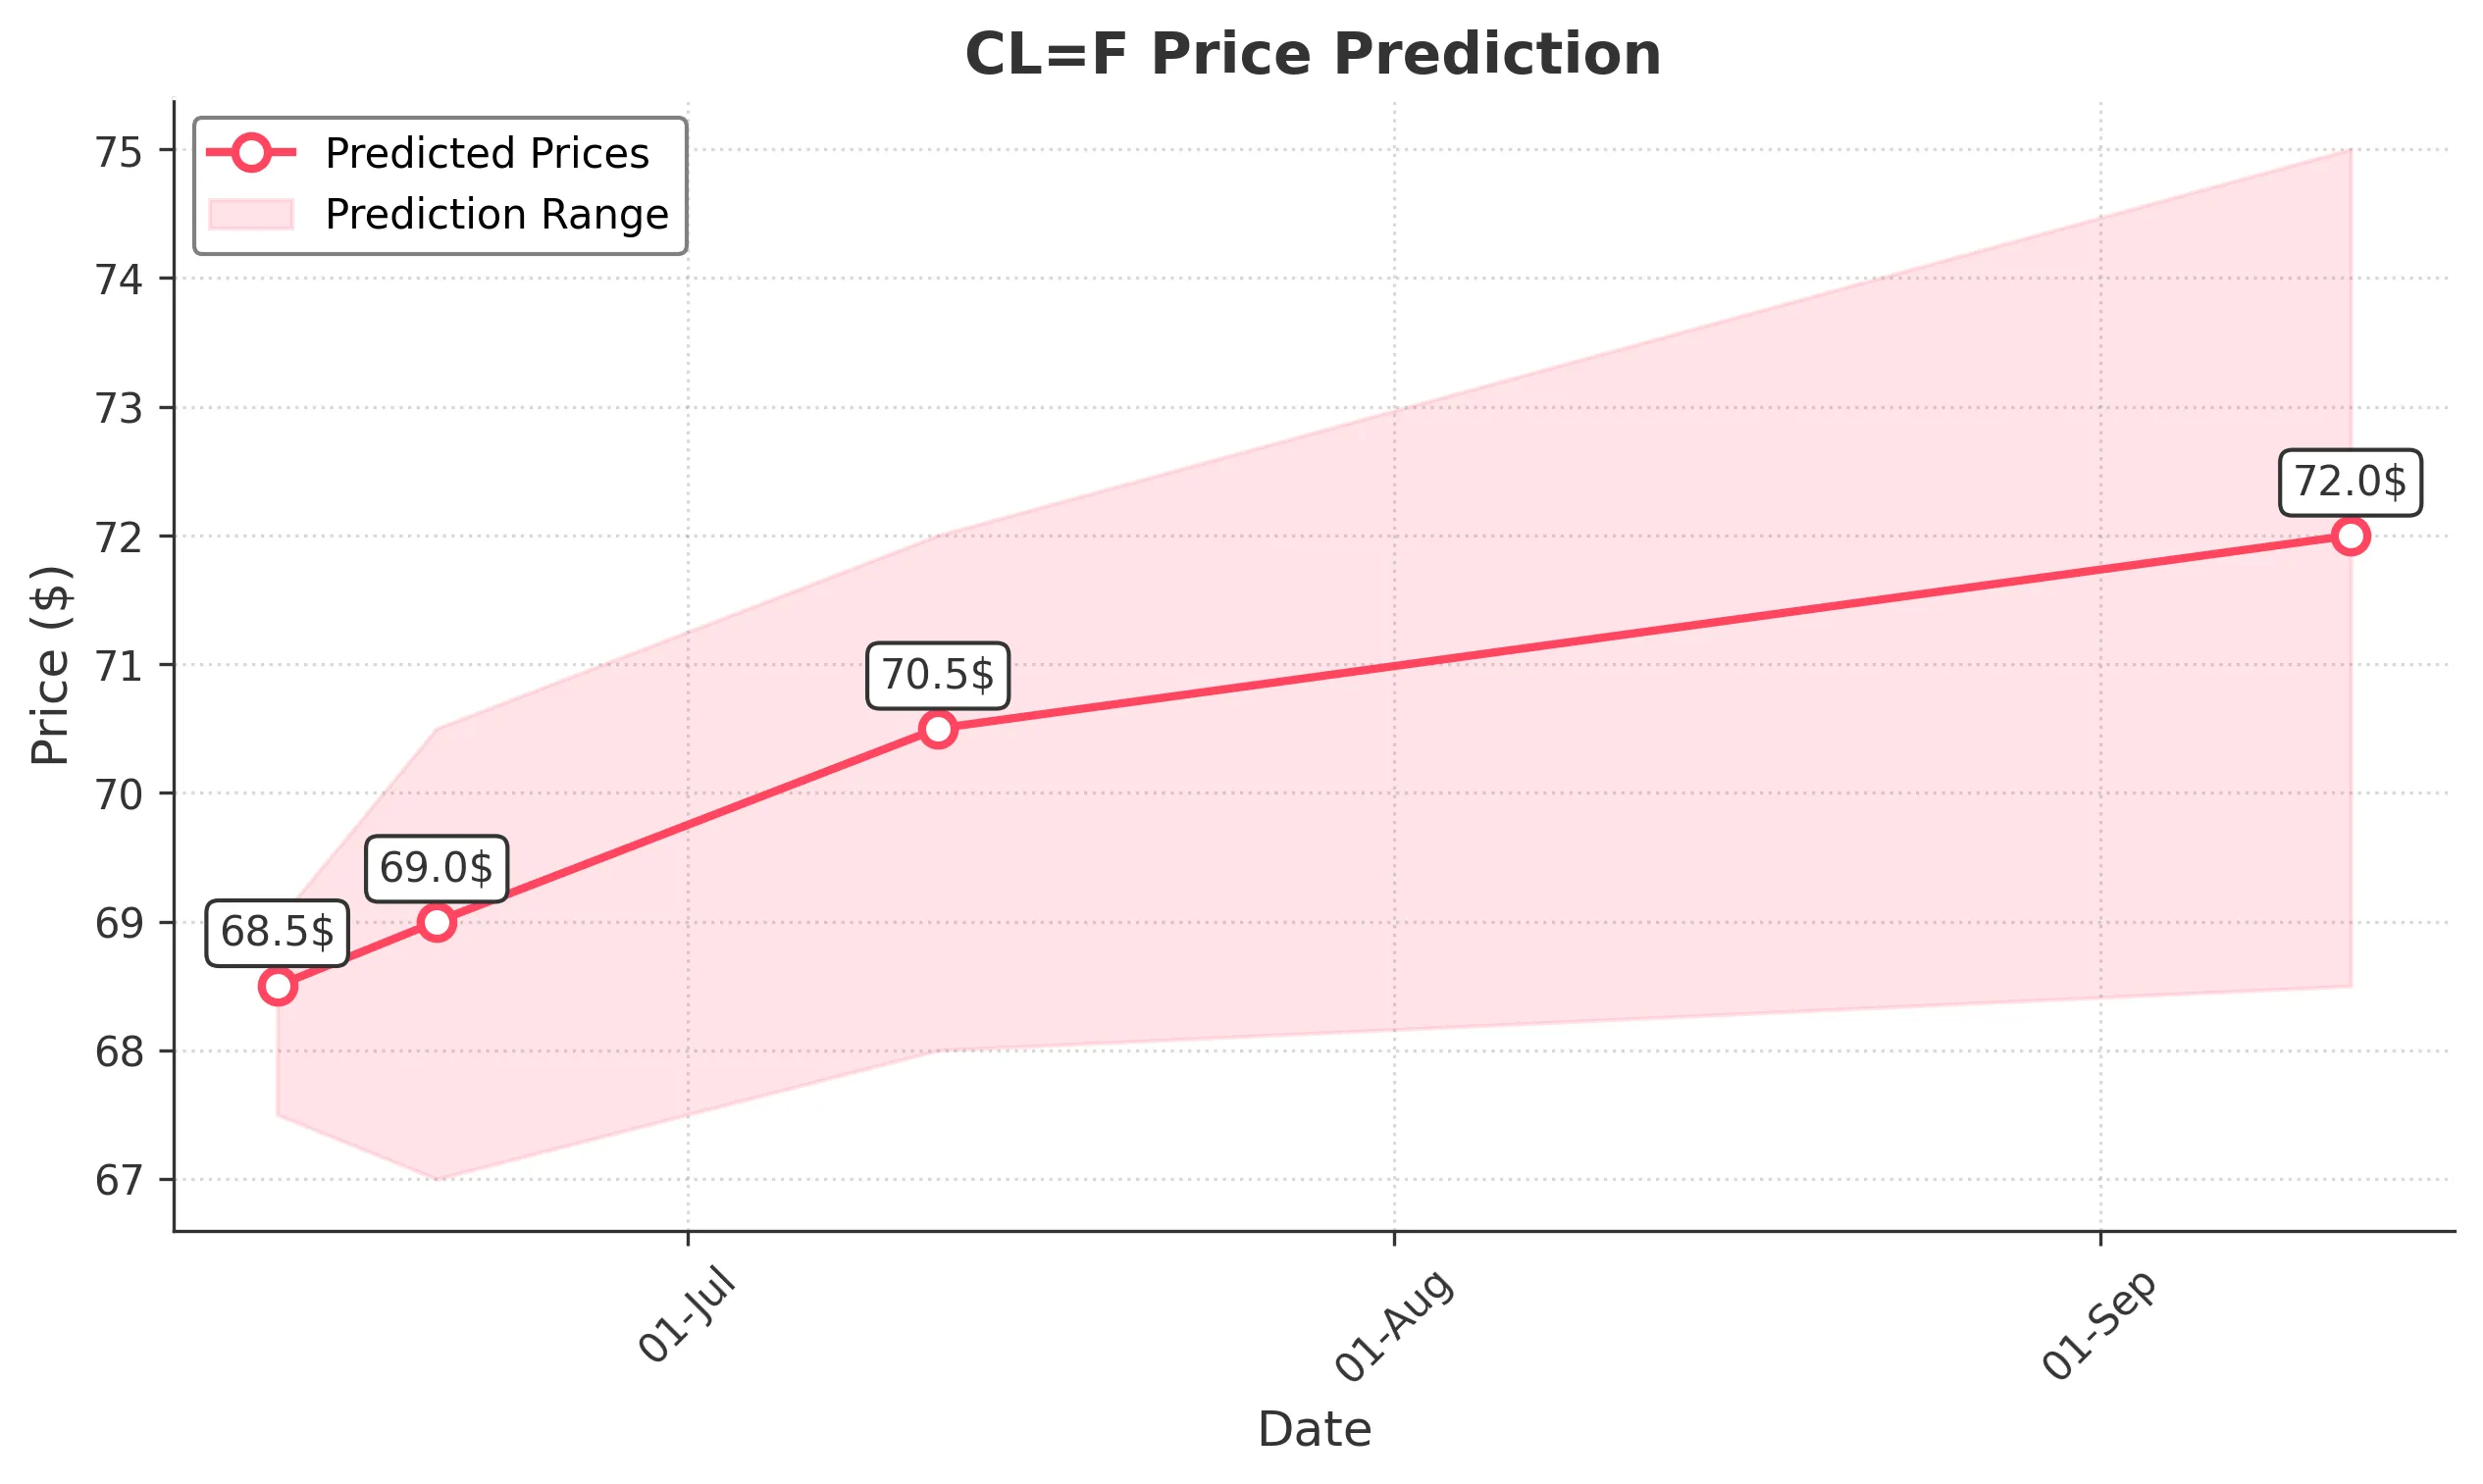
Target: June 13, 2025$68.5
$68
$69
$67.5
Description
The stock shows bullish momentum with a recent upward trend. The RSI is approaching overbought levels, indicating potential for a pullback. However, the MACD remains positive, suggesting continued upward movement. Volume is expected to increase as traders react to recent price action.
Analysis
Over the past 3 months, CL=F has shown a bullish trend with significant support at $60 and resistance around $70. Recent price action indicates a recovery from a dip, with moving averages indicating upward momentum. Volume spikes during upward moves suggest strong buying interest.
Confidence Level
Potential Risks
Potential for a short-term pullback due to overbought RSI conditions.
1 Week Prediction
Target: June 20, 2025$69
$68.5
$70.5
$67
Description
The stock is expected to continue its upward trajectory, supported by bullish candlestick patterns and positive MACD signals. However, the RSI indicates potential overbought conditions, which could lead to volatility. Volume is likely to remain strong as traders react to market sentiment.
Analysis
The stock has been in a bullish phase, with key support at $66 and resistance at $70. The recent price action shows a recovery from a dip, with moving averages indicating upward momentum. Volume patterns suggest strong buying interest, but caution is warranted due to potential overbought conditions.
Confidence Level
Potential Risks
Market volatility and potential profit-taking could impact price stability.
1 Month Prediction
Target: July 12, 2025$70.5
$69.5
$72
$68
Description
The stock is projected to reach higher levels as bullish sentiment persists. The MACD remains positive, and the price is above key moving averages. However, the RSI indicates potential overbought conditions, which may lead to corrections. Volume is expected to support upward movement.
Analysis
CL=F has shown a strong bullish trend with significant support at $66 and resistance at $72. The recent price action indicates a recovery, with moving averages supporting upward momentum. Volume spikes during upward moves suggest strong buying interest, but caution is advised due to potential overbought conditions.
Confidence Level
Potential Risks
Market corrections and external economic factors could influence price direction.
3 Months Prediction
Target: September 12, 2025$72
$70
$75
$68.5
Description
The stock is expected to maintain an upward trend, supported by strong market sentiment and positive technical indicators. However, potential resistance at $75 may lead to volatility. Volume is likely to remain robust as traders react to market developments.
Analysis
Over the past 3 months, CL=F has shown a bullish trend with key support at $66 and resistance around $75. The stock has recovered from recent dips, with moving averages indicating upward momentum. Volume patterns suggest strong buying interest, but potential market corrections and external factors could influence future performance.
Confidence Level
Potential Risks
Unforeseen macroeconomic events and market corrections could impact price stability.