OIL Trading Predictions
1 Day Prediction
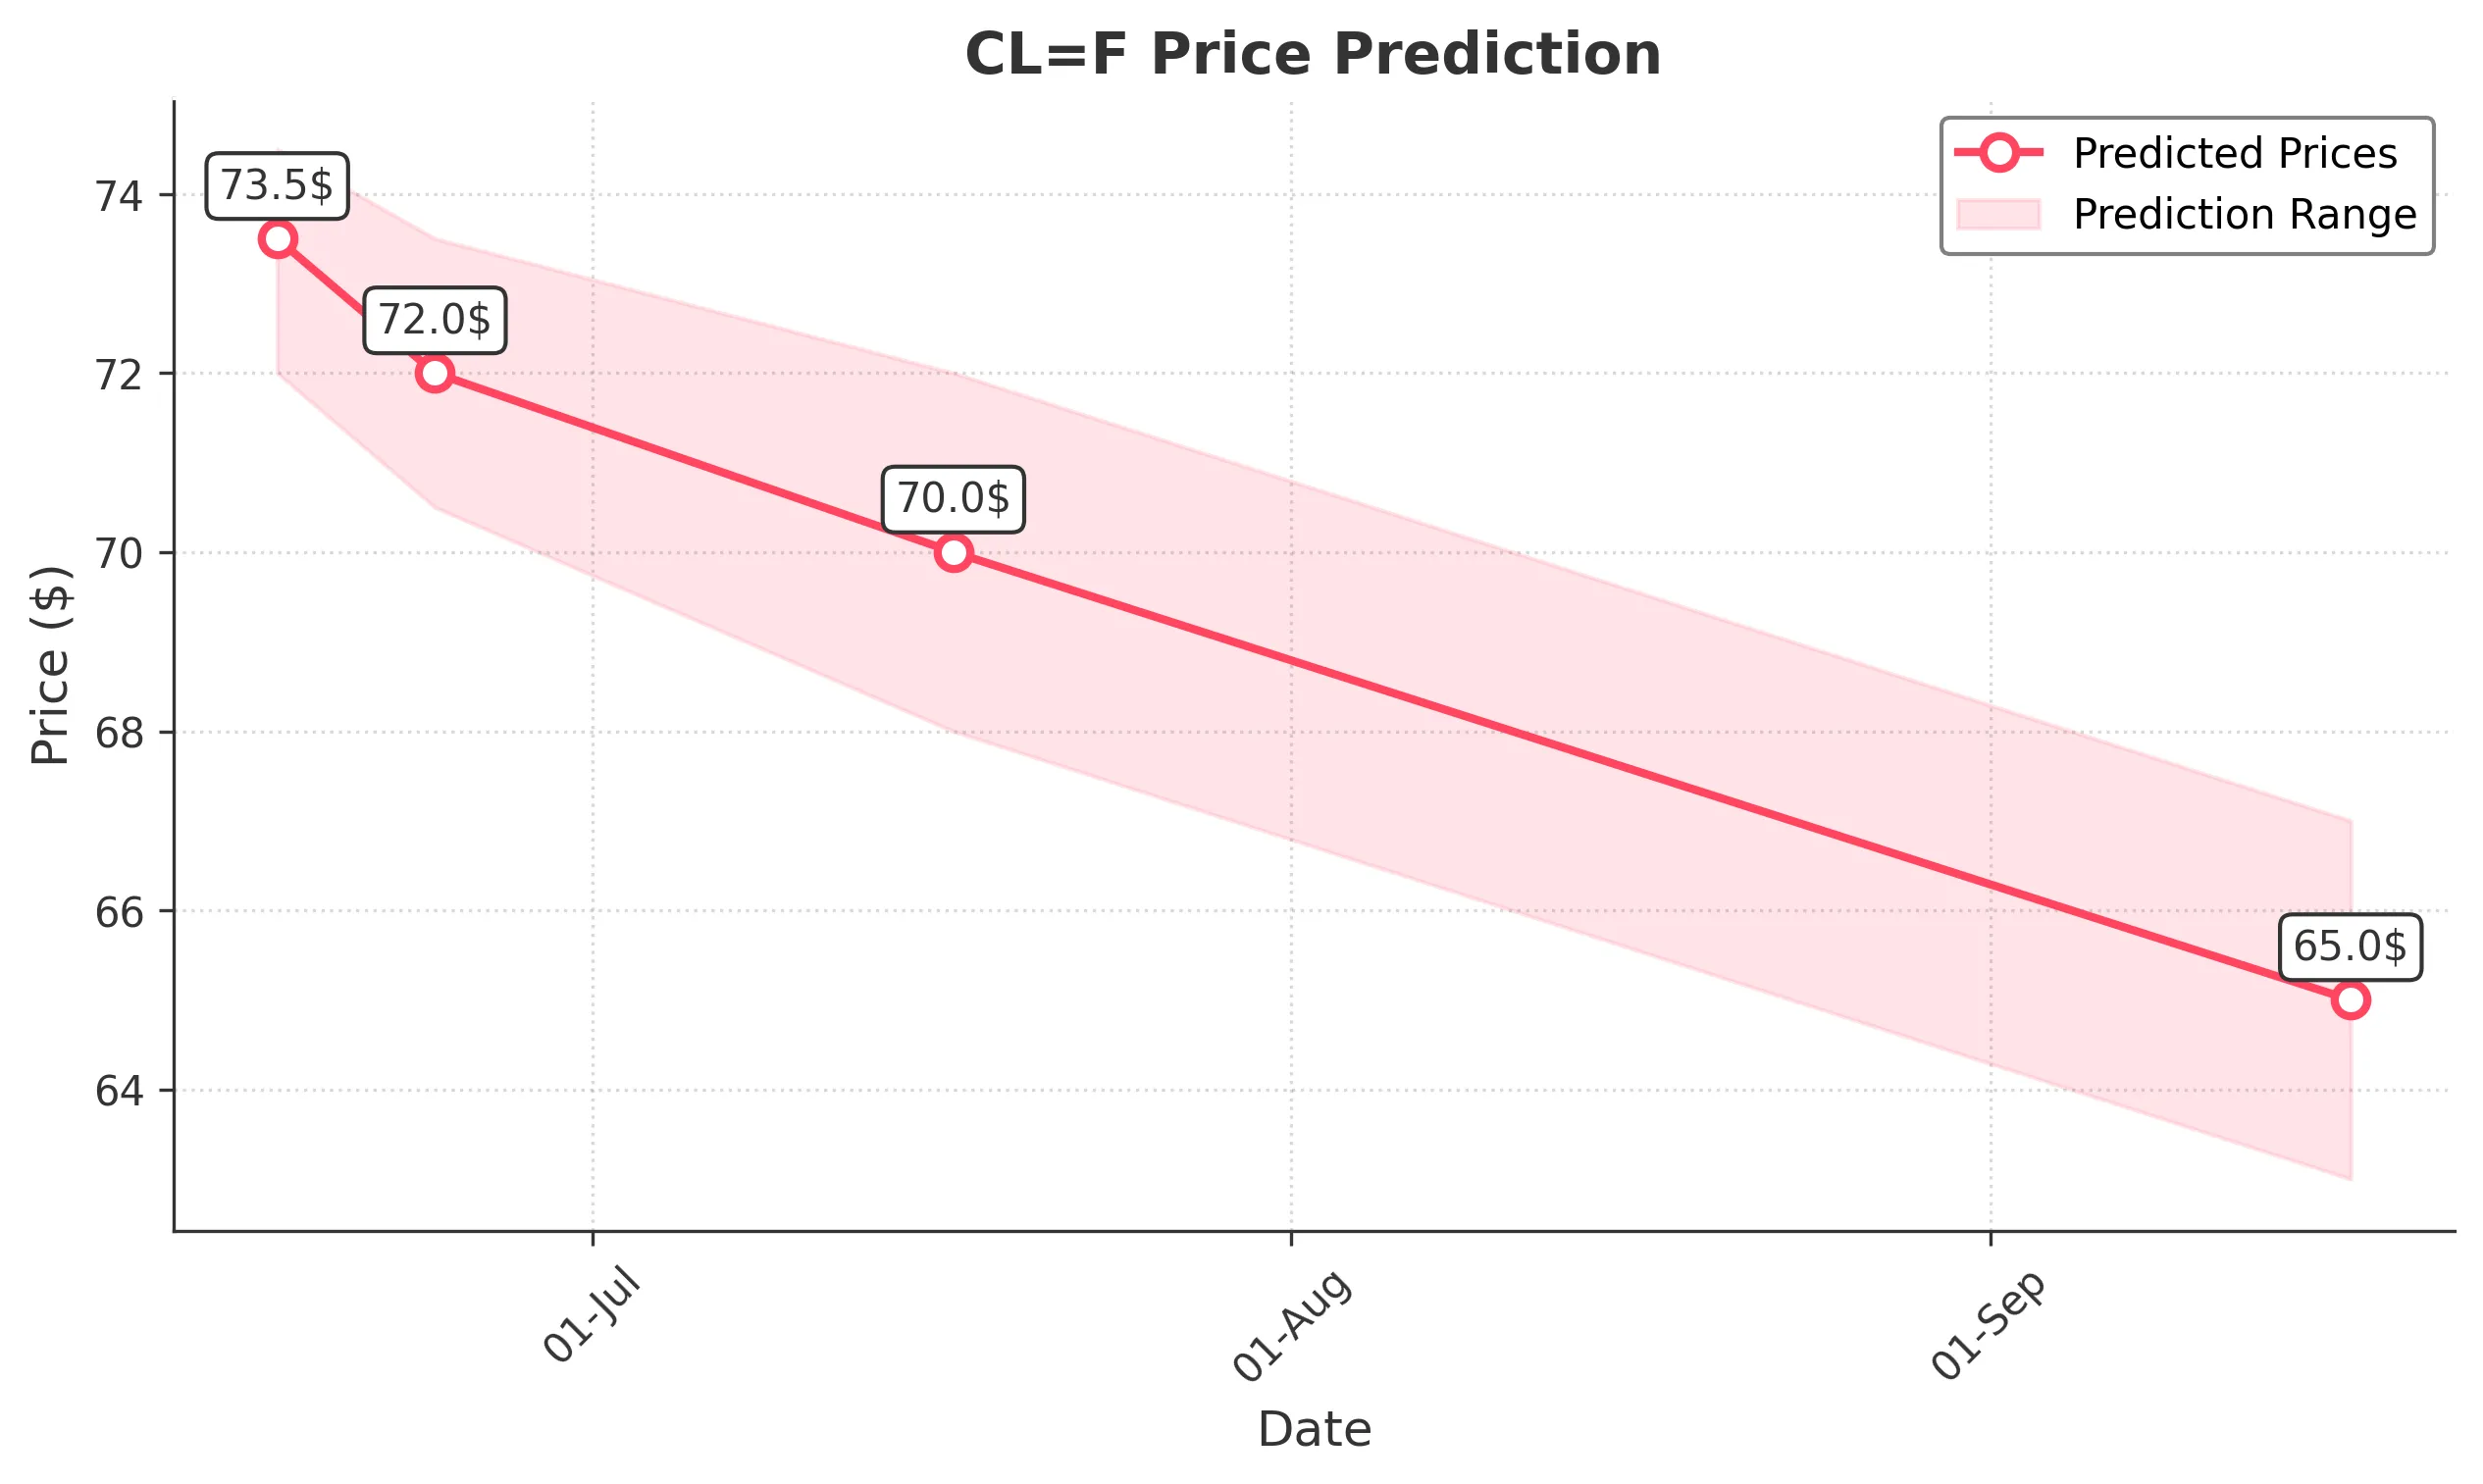
Target: June 17, 2025$73.5
$73
$74.5
$72
Description
The stock shows bullish momentum with a recent upward trend. The RSI is nearing overbought levels, suggesting a potential pullback. However, strong support at $72.00 may hold. Expect volatility due to market sentiment.
Analysis
Over the past 3 months, CL=F has shown a bullish trend with significant upward movements, particularly in early June. Key resistance is around $74.00, while support is at $72.00. Volume has been increasing, indicating strong interest. However, the recent high RSI suggests caution.
Confidence Level
Potential Risks
Potential reversal signals from overbought RSI and recent high volatility could lead to unexpected price movements.
1 Week Prediction
Target: June 24, 2025$72
$73
$73.5
$70.5
Description
Expect a slight pullback as the stock approaches resistance levels. The MACD shows signs of divergence, indicating potential weakening momentum. Watch for support at $70.50.
Analysis
The stock has been volatile, with significant price swings. The recent highs indicate bullish sentiment, but the MACD divergence and high RSI suggest a potential correction. Key support at $70.50 will be crucial in the coming week.
Confidence Level
Potential Risks
Market sentiment could shift rapidly, and any negative news could exacerbate the pullback.
1 Month Prediction
Target: July 17, 2025$70
$71
$72
$68
Description
A bearish trend may develop as the stock faces resistance. The Bollinger Bands indicate potential price contraction, and the RSI suggests overbought conditions. Expect a gradual decline towards support levels.
Analysis
The stock has shown strong performance but is now facing resistance. The Bollinger Bands are tightening, indicating potential price consolidation. The RSI is high, suggesting a correction may be imminent. Key support at $68.00 will be critical.
Confidence Level
Potential Risks
Unforeseen macroeconomic events or changes in market sentiment could lead to volatility and affect the prediction.
3 Months Prediction
Target: September 17, 2025$65
$66
$67
$63
Description
Long-term bearish sentiment may prevail as the stock approaches key resistance levels. The MACD indicates a potential downtrend, and volume patterns suggest weakening interest. Watch for support at $63.00.
Analysis
Over the past three months, CL=F has experienced significant fluctuations. The overall trend appears to be shifting towards bearish as resistance levels are tested. The MACD and volume patterns indicate weakening momentum, and external factors could further influence price movements.
Confidence Level
Potential Risks
Market volatility and external economic factors could significantly impact the stock's performance.