OIL Trading Predictions
1 Day Prediction
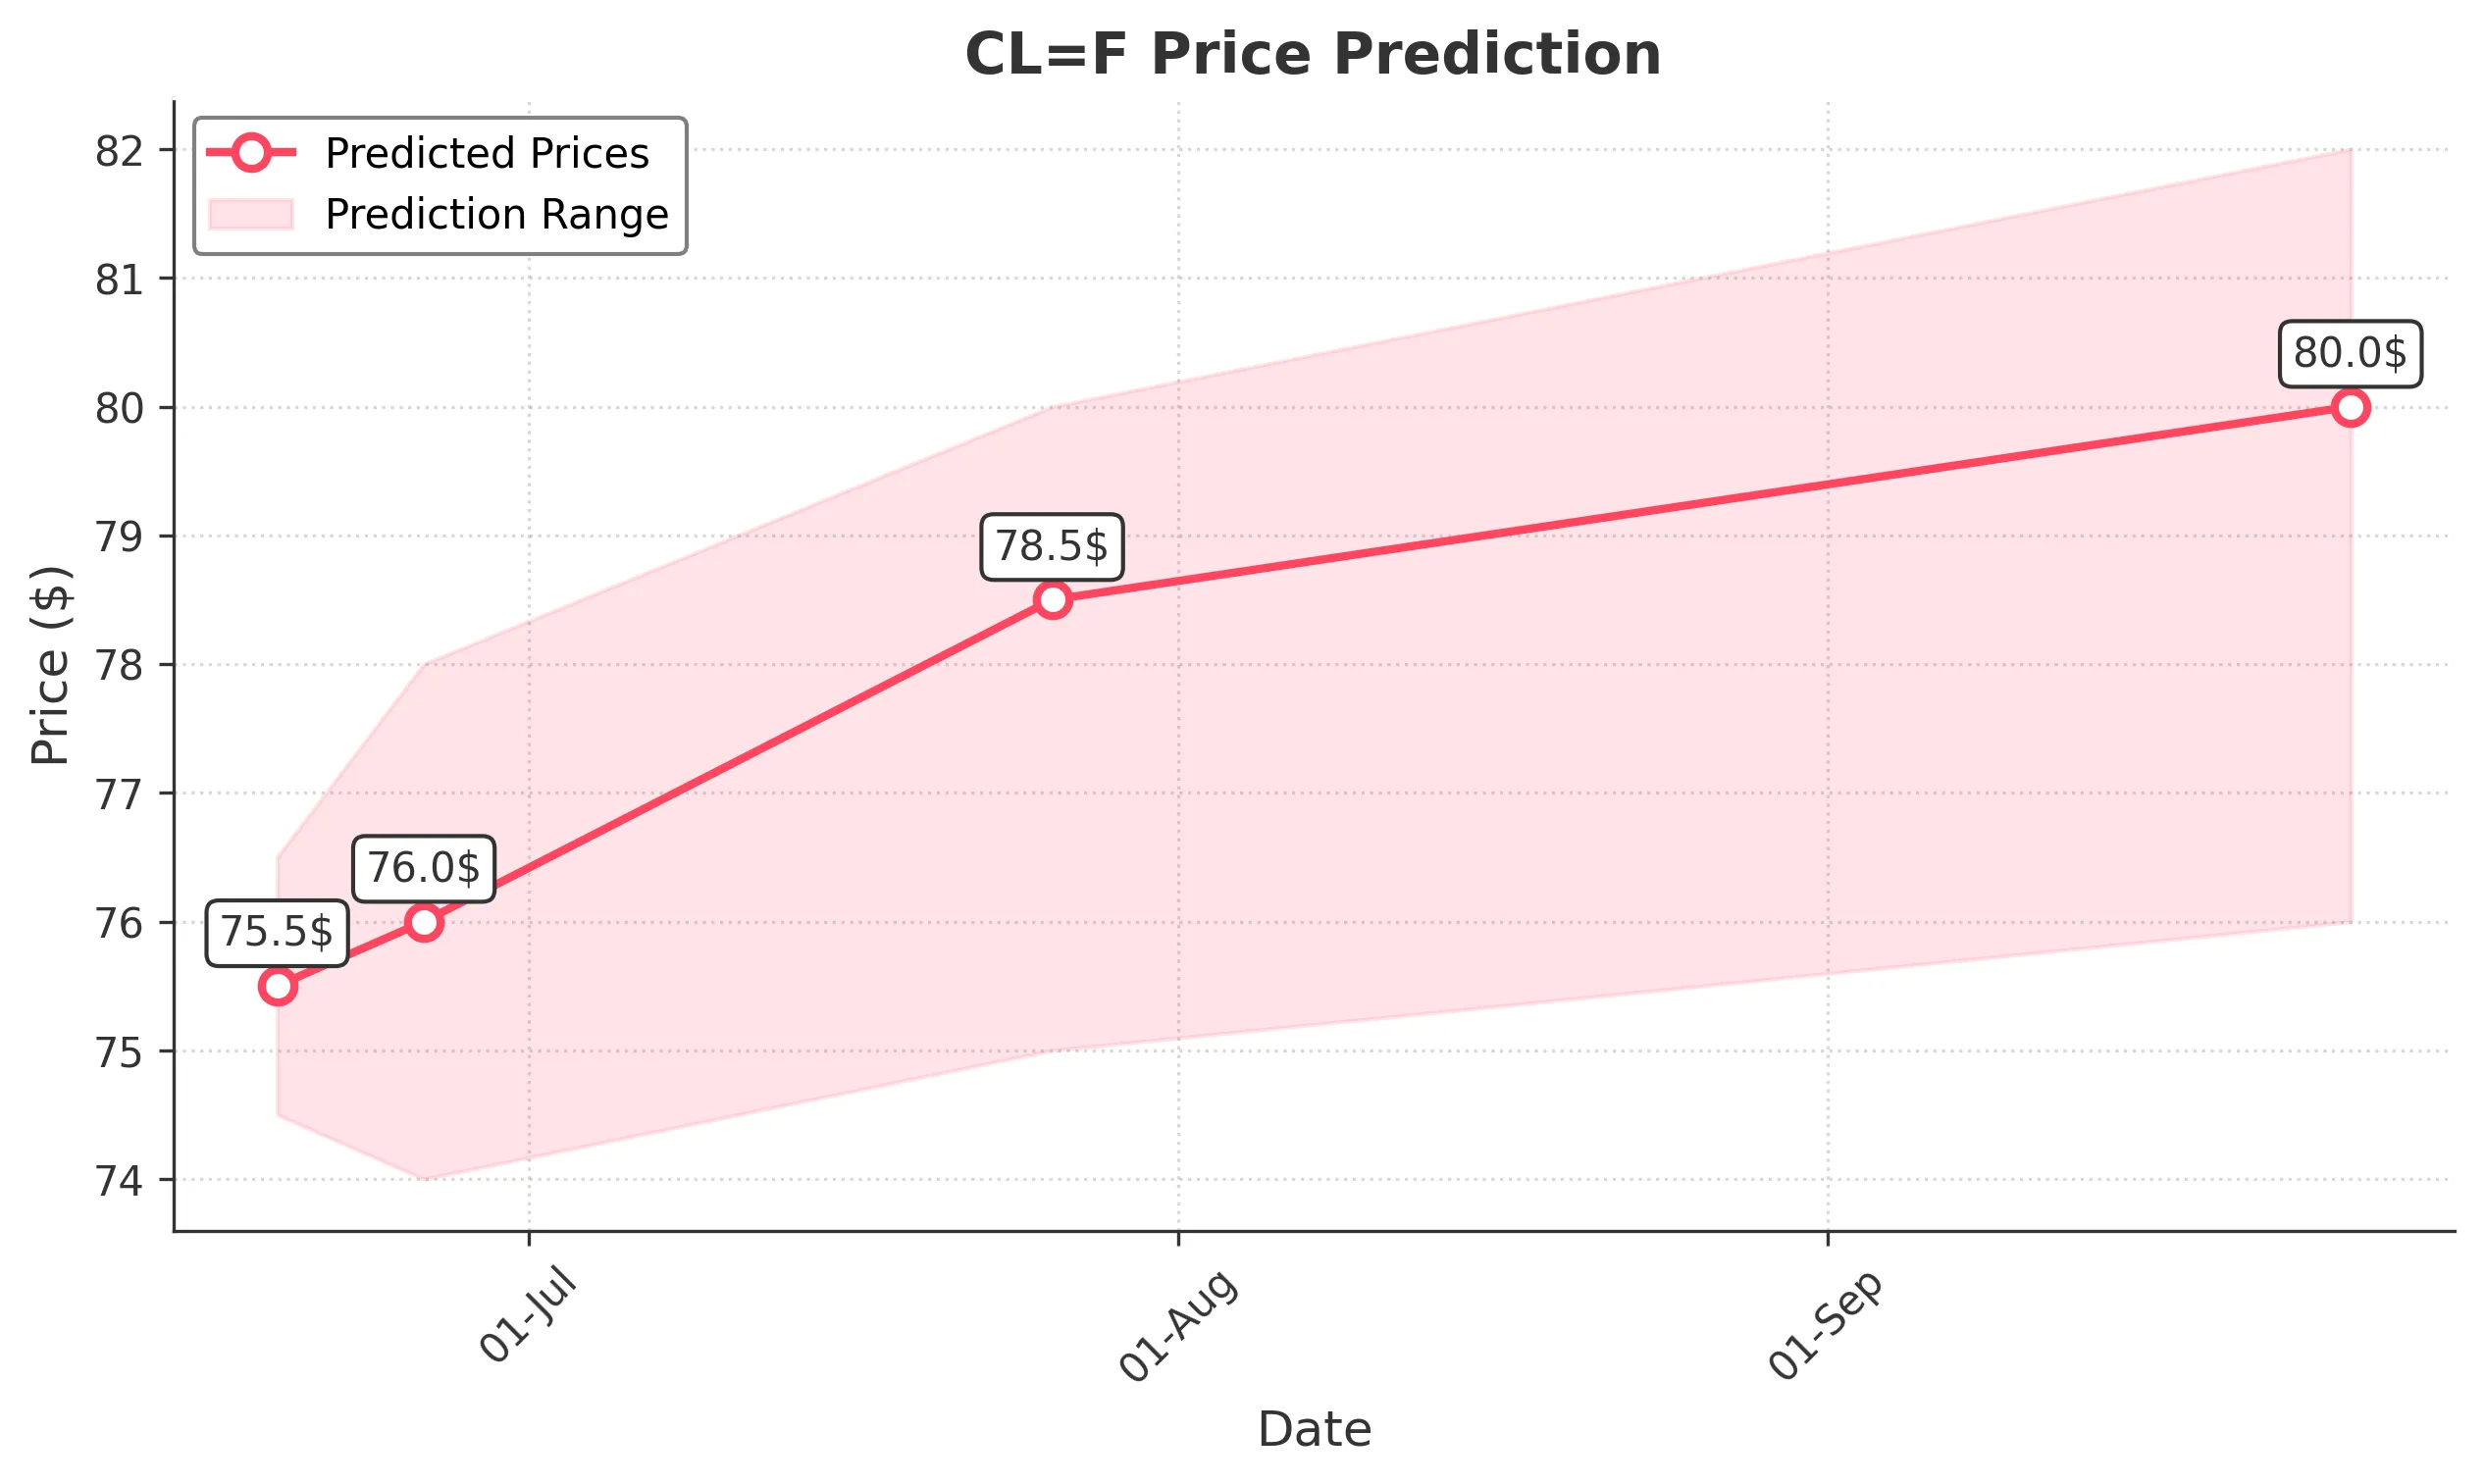
Target: June 19, 2025$75.5
$75.2
$76.5
$74.5
Description
The stock shows bullish momentum with a recent upward trend. The RSI is approaching overbought levels, indicating potential for a pullback. However, strong volume and a bullish candlestick pattern suggest continued upward movement.
Analysis
Over the past 3 months, CL=F has shown a bullish trend, with significant support at $70 and resistance around $77. The MACD indicates upward momentum, while volume spikes suggest strong buying interest. Recent candlestick patterns support a bullish outlook.
Confidence Level
Potential Risks
Potential reversal if RSI exceeds overbought levels. Market sentiment may shift due to external factors.
1 Week Prediction
Target: June 26, 2025$76
$75.5
$78
$74
Description
The stock is expected to continue its upward trajectory, supported by strong volume and bullish technical indicators. However, the RSI indicates potential overbought conditions, which could lead to volatility.
Analysis
The stock has maintained a bullish trend with key support at $70. The MACD and moving averages indicate upward momentum, while recent volume spikes suggest strong buying interest. However, the RSI nearing overbought levels raises caution.
Confidence Level
Potential Risks
Market corrections or negative news could impact the stock's performance, leading to a potential pullback.
1 Month Prediction
Target: July 26, 2025$78.5
$76
$80
$75
Description
The stock is likely to reach new highs as bullish sentiment persists. The Fibonacci retracement levels suggest a target around $78.50, but overbought conditions may lead to corrections.
Analysis
CL=F has shown a strong bullish trend with significant resistance at $80. The MACD and moving averages support upward momentum, while volume patterns indicate strong buying. However, potential market corrections should be monitored.
Confidence Level
Potential Risks
External economic factors or earnings reports could lead to unexpected volatility, impacting the stock's trajectory.
3 Months Prediction
Target: September 26, 2025$80
$78
$82
$76
Description
The stock is expected to maintain its bullish trend, potentially reaching $80. However, market volatility and economic conditions could introduce risks.
Analysis
Over the past 3 months, CL=F has demonstrated a strong upward trend with key support at $70. The MACD and moving averages indicate bullish momentum, but potential market corrections and external factors could impact future performance.
Confidence Level
Potential Risks
Unforeseen macroeconomic events or shifts in market sentiment could lead to significant price fluctuations.