OIL Trading Predictions
1 Day Prediction
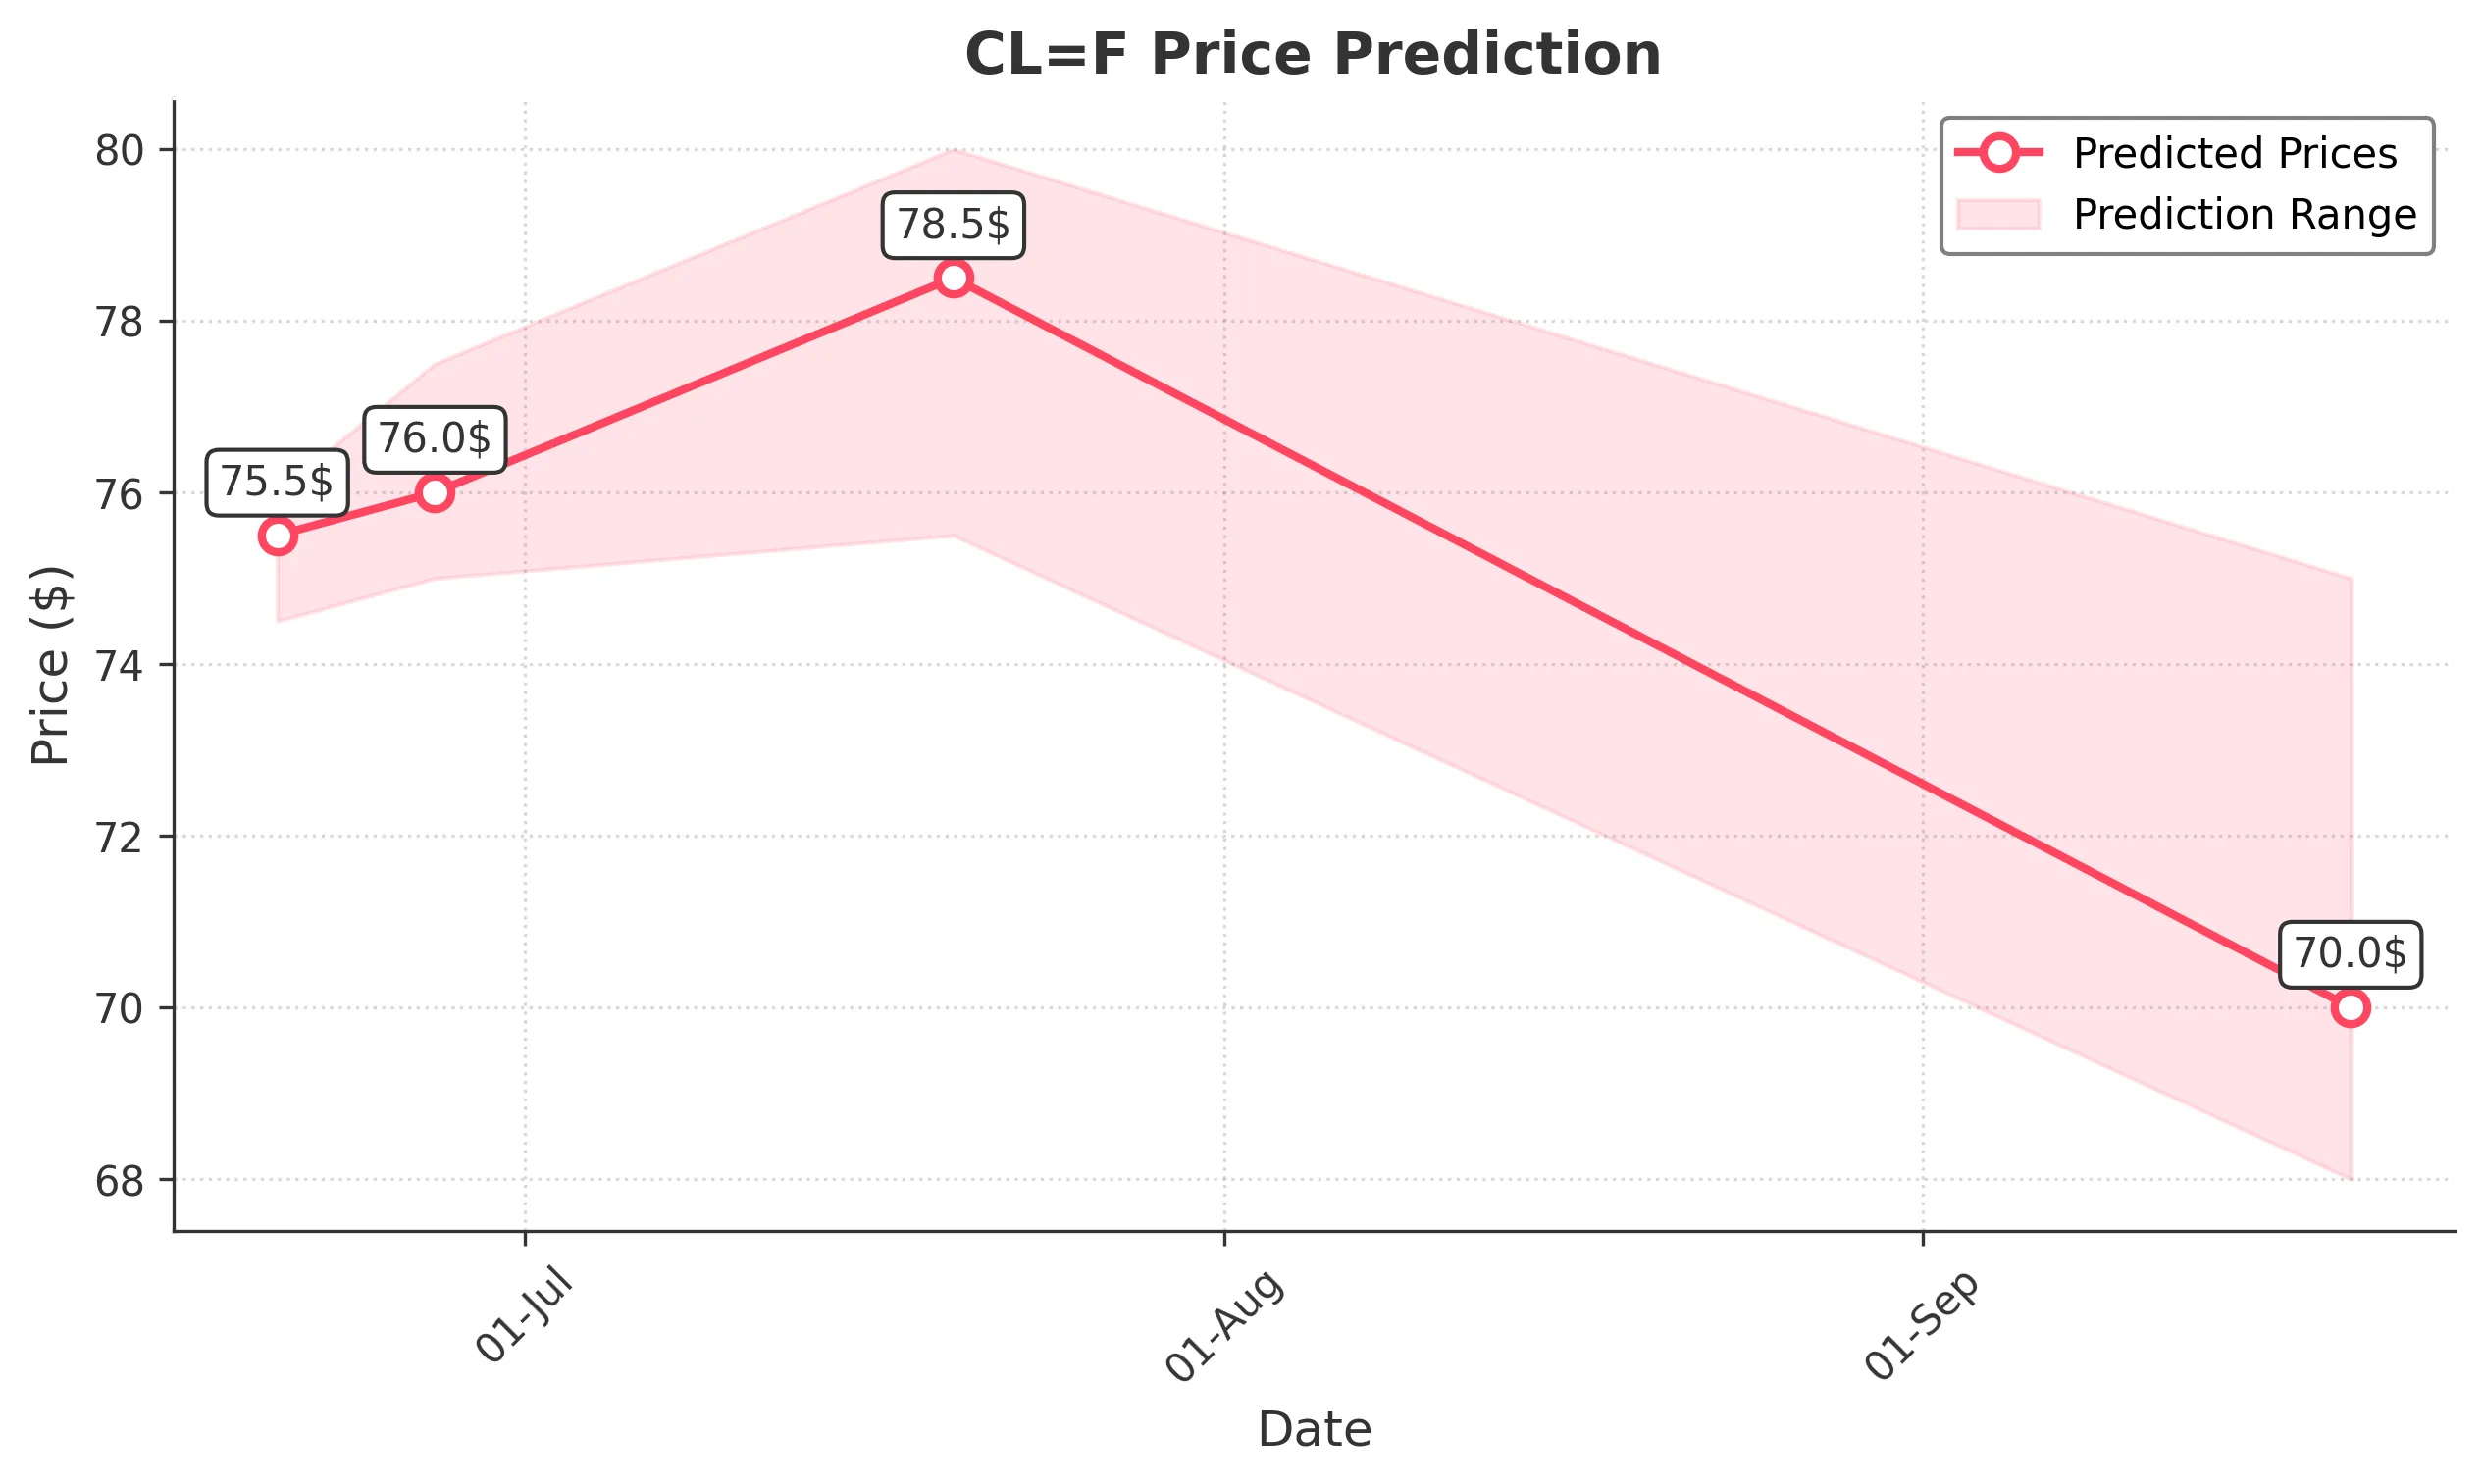
Target: June 20, 2025$75.5
$75.2
$76
$74.5
Description
The stock shows bullish momentum with a recent upward trend. The RSI is approaching overbought levels, indicating potential for a pullback. However, strong support at 74.50 and resistance at 76.00 suggest a range-bound movement. Volume remains stable.
Analysis
Over the past 3 months, CL=F has shown a bullish trend with significant upward movements, particularly in early June. Key support is at 74.50, while resistance is at 76.00. The MACD indicates bullish momentum, but the RSI suggests caution as it nears overbought territory. Volume has been consistent, indicating strong interest.
Confidence Level
Potential Risks
Potential for a pullback if RSI exceeds overbought levels. Market sentiment may shift due to external factors.
1 Week Prediction
Target: June 27, 2025$76
$75.8
$77.5
$75
Description
The stock is expected to continue its upward trajectory, supported by bullish sentiment and strong volume. However, the RSI indicates potential overbought conditions, which could lead to volatility. Resistance at 77.50 may limit upside.
Analysis
The stock has maintained a bullish trend, with significant price increases in June. The MACD remains positive, and volume spikes indicate strong buying interest. However, the RSI nearing overbought levels suggests caution. Key resistance at 77.50 could pose challenges.
Confidence Level
Potential Risks
Market volatility and external economic factors could impact the stock's performance. Watch for any bearish reversal patterns.
1 Month Prediction
Target: July 20, 2025$78.5
$76.5
$80
$75.5
Description
The stock is projected to reach new highs as bullish momentum persists. The MACD remains strong, and volume trends indicate continued interest. However, potential resistance at 80.00 may limit further gains.
Analysis
CL=F has shown a strong bullish trend, particularly in June. The MACD and moving averages support upward movement, but the RSI indicates potential overbought conditions. Volume patterns suggest sustained interest, but resistance at 80.00 could present challenges.
Confidence Level
Potential Risks
Market corrections or negative news could reverse the trend. Watch for signs of bearish divergence in technical indicators.
3 Months Prediction
Target: September 20, 2025$70
$72
$75
$68
Description
A potential correction is anticipated as the stock may face resistance and profit-taking. The RSI indicates overbought conditions, and macroeconomic factors could influence market sentiment negatively.
Analysis
While the stock has shown strong performance recently, the potential for a correction looms as the RSI indicates overbought conditions. Key support at 68.00 and resistance at 75.00 will be critical. Volume trends suggest interest may wane, leading to a possible pullback.
Confidence Level
Potential Risks
Unforeseen economic events or shifts in market sentiment could lead to significant volatility. Watch for bearish patterns.