OIL Trading Predictions
1 Day Prediction
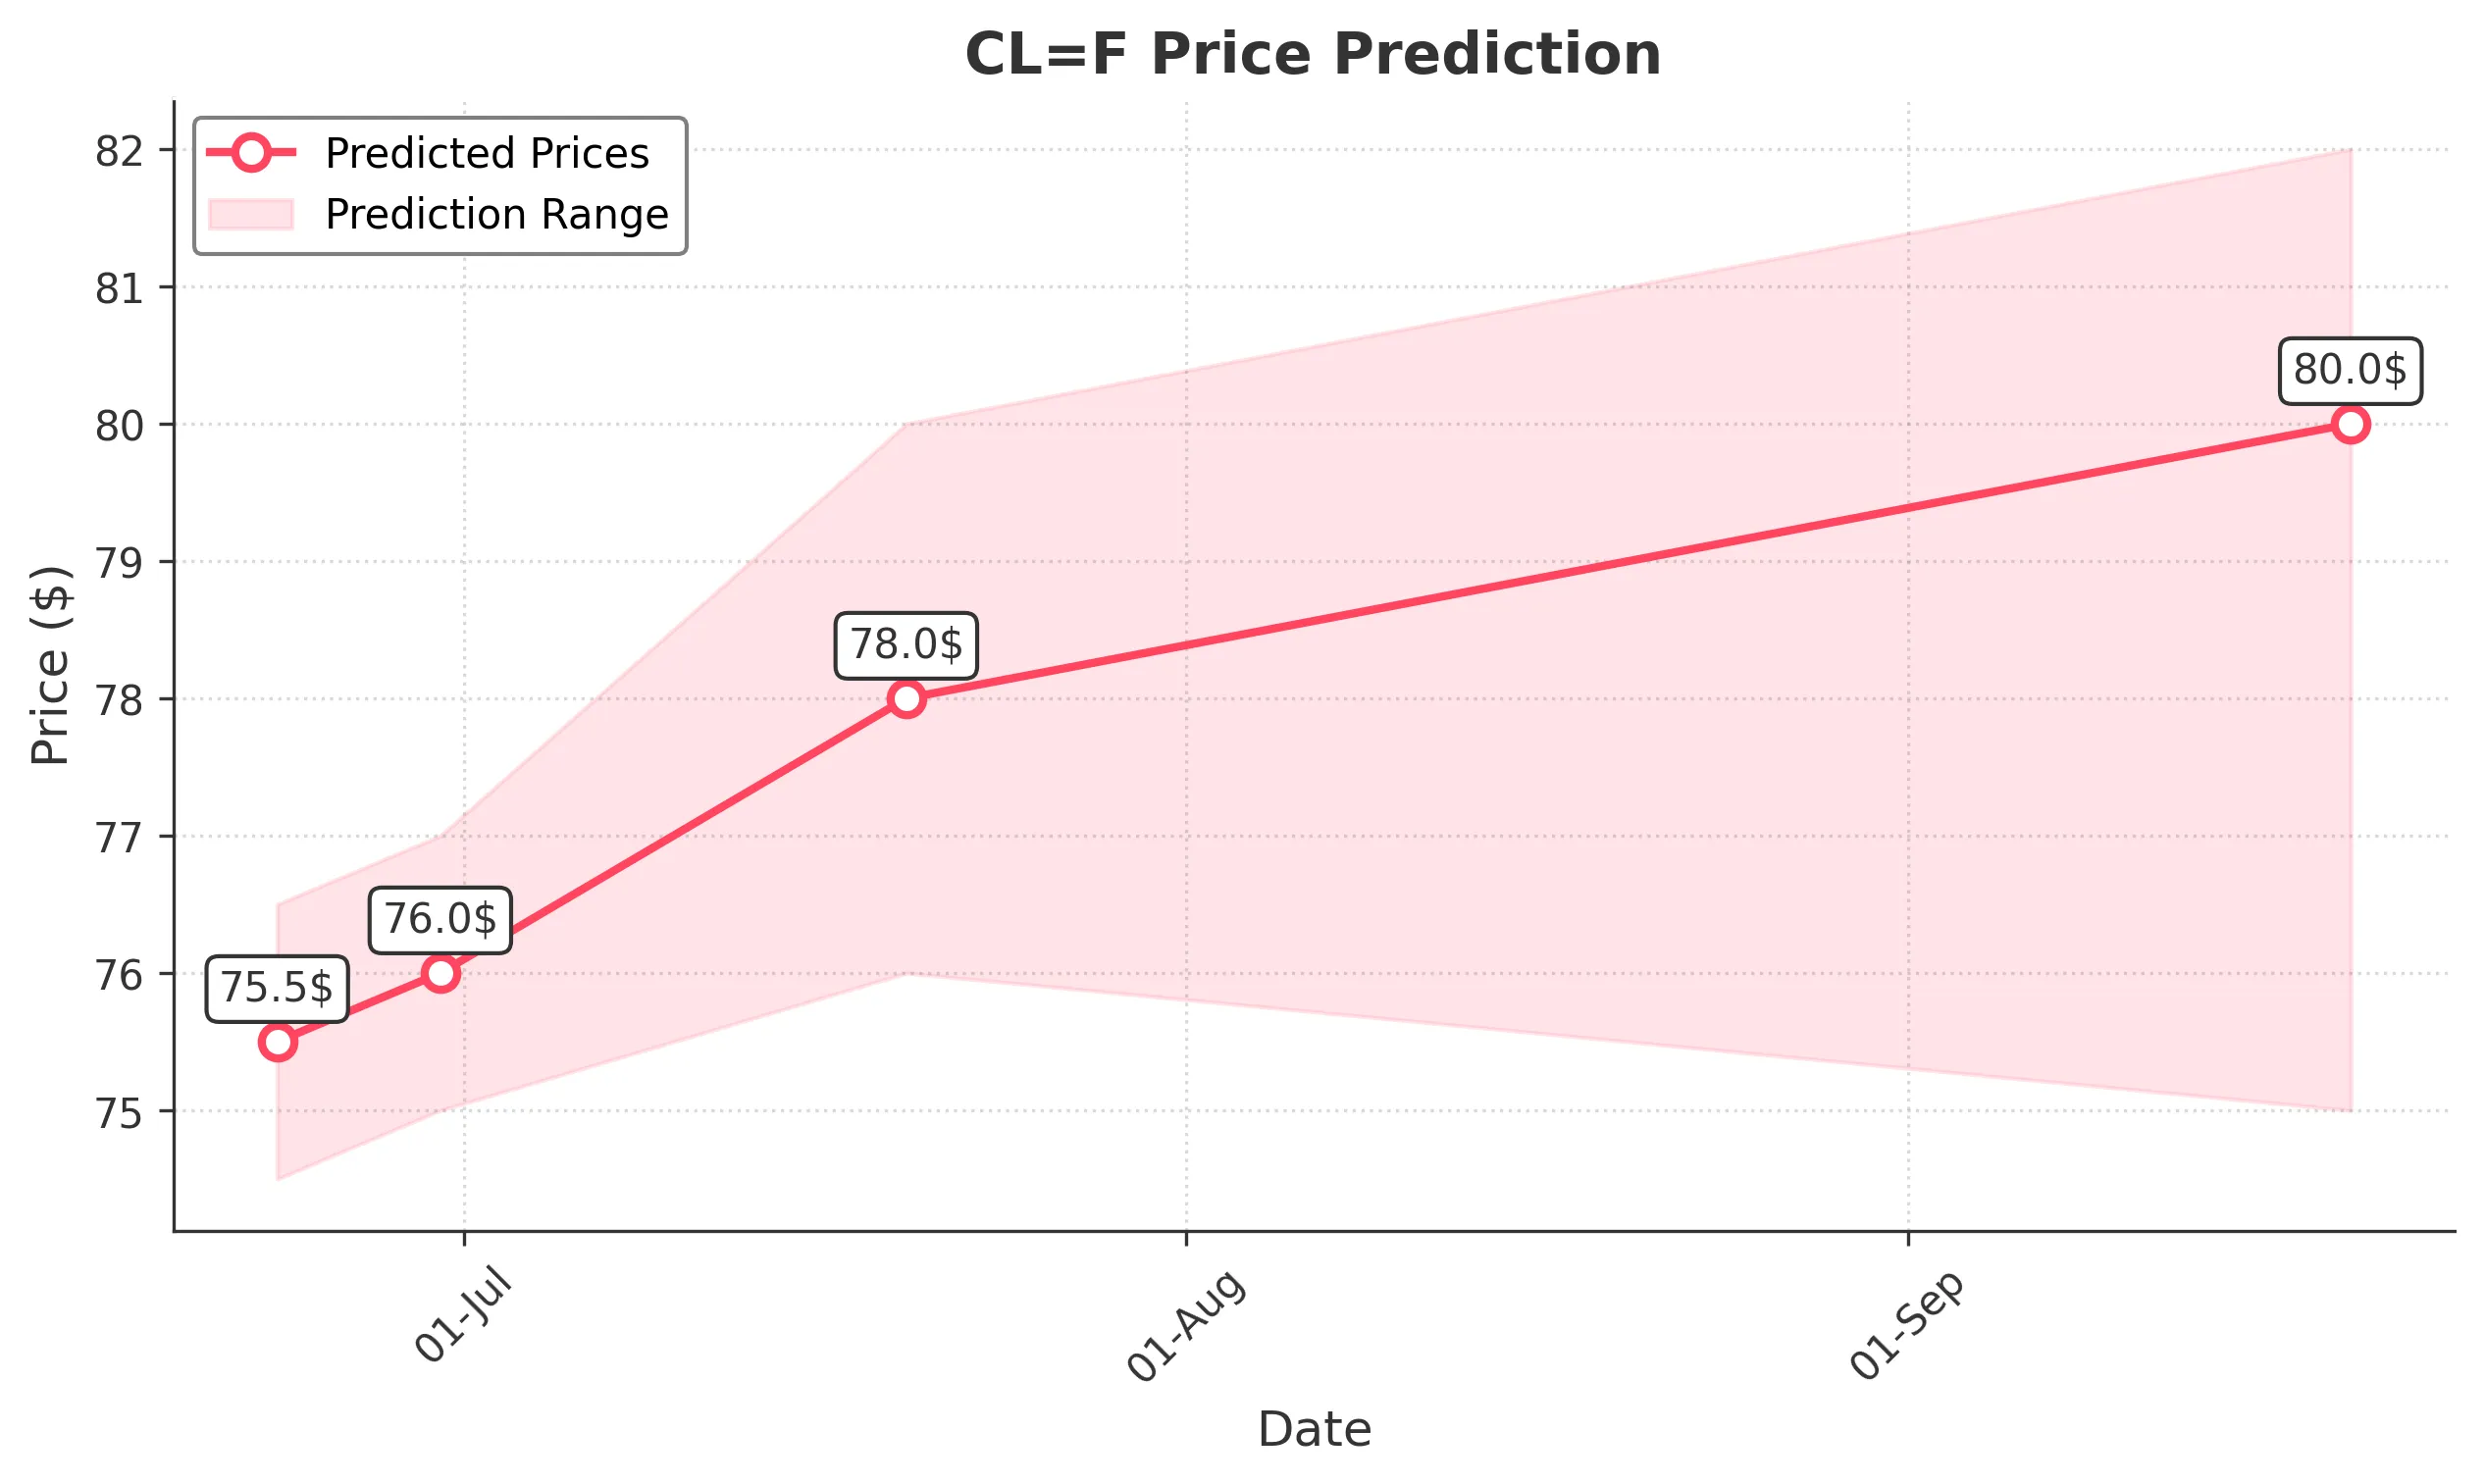
Target: June 23, 2025$75.5
$75.2
$76.5
$74.5
Description
The stock shows bullish momentum with a recent upward trend. The RSI is approaching overbought levels, indicating potential for a pullback. However, strong support at $74.50 and resistance at $76.50 suggest a range-bound movement. Volume remains stable.
Analysis
Over the past 3 months, CL=F has shown a bullish trend, especially after a significant rally in early June. Key support is at $74.50, while resistance is at $76.50. The MACD indicates upward momentum, but the RSI suggests caution as it nears overbought territory. Volume has been consistent, with some spikes indicating strong buying interest.
Confidence Level
Potential Risks
Potential market volatility and external economic factors could impact the prediction.
1 Week Prediction
Target: June 30, 2025$76
$75.8
$77
$75
Description
The stock is expected to continue its upward trajectory, supported by strong buying pressure. The Bollinger Bands indicate potential for a breakout above $76.00. However, the RSI suggests caution as it approaches overbought levels.
Analysis
CL=F has maintained a bullish trend, with significant price increases in June. The MACD is positive, and the stock is trading above its moving averages. Key resistance is at $77.00, while support is at $75.00. Volume patterns indicate strong interest, but the RSI nearing overbought levels raises concerns about a potential pullback.
Confidence Level
Potential Risks
Market sentiment could shift due to macroeconomic news, affecting the stock's performance.
1 Month Prediction
Target: July 20, 2025$78
$77.5
$80
$76
Description
The stock is likely to reach new highs as bullish sentiment persists. The Fibonacci retracement levels suggest a target around $78.00. However, the RSI indicates potential overbought conditions, which could lead to volatility.
Analysis
In the last three months, CL=F has shown a strong upward trend, with significant price movements. The stock is currently above key moving averages, and the MACD supports bullish momentum. However, the RSI indicates overbought conditions, suggesting a possible correction. Volume has been increasing, indicating strong buying interest.
Confidence Level
Potential Risks
Unforeseen market events or economic data releases could lead to price corrections.
3 Months Prediction
Target: September 20, 2025$80
$79
$82
$75
Description
The stock is expected to continue its upward trend, potentially reaching $80.00. However, the market may experience corrections due to profit-taking. The overall bullish sentiment remains strong, but caution is advised as the RSI approaches overbought levels.
Analysis
CL=F has demonstrated a strong bullish trend over the past three months, with significant price increases. Key support is at $75.00, while resistance is at $82.00. The MACD indicates continued bullish momentum, but the RSI suggests caution as it nears overbought territory. Volume patterns show strong interest, but potential market corrections could pose risks.
Confidence Level
Potential Risks
Market corrections and external economic factors could significantly impact the stock's performance.