OIL Trading Predictions
1 Day Prediction
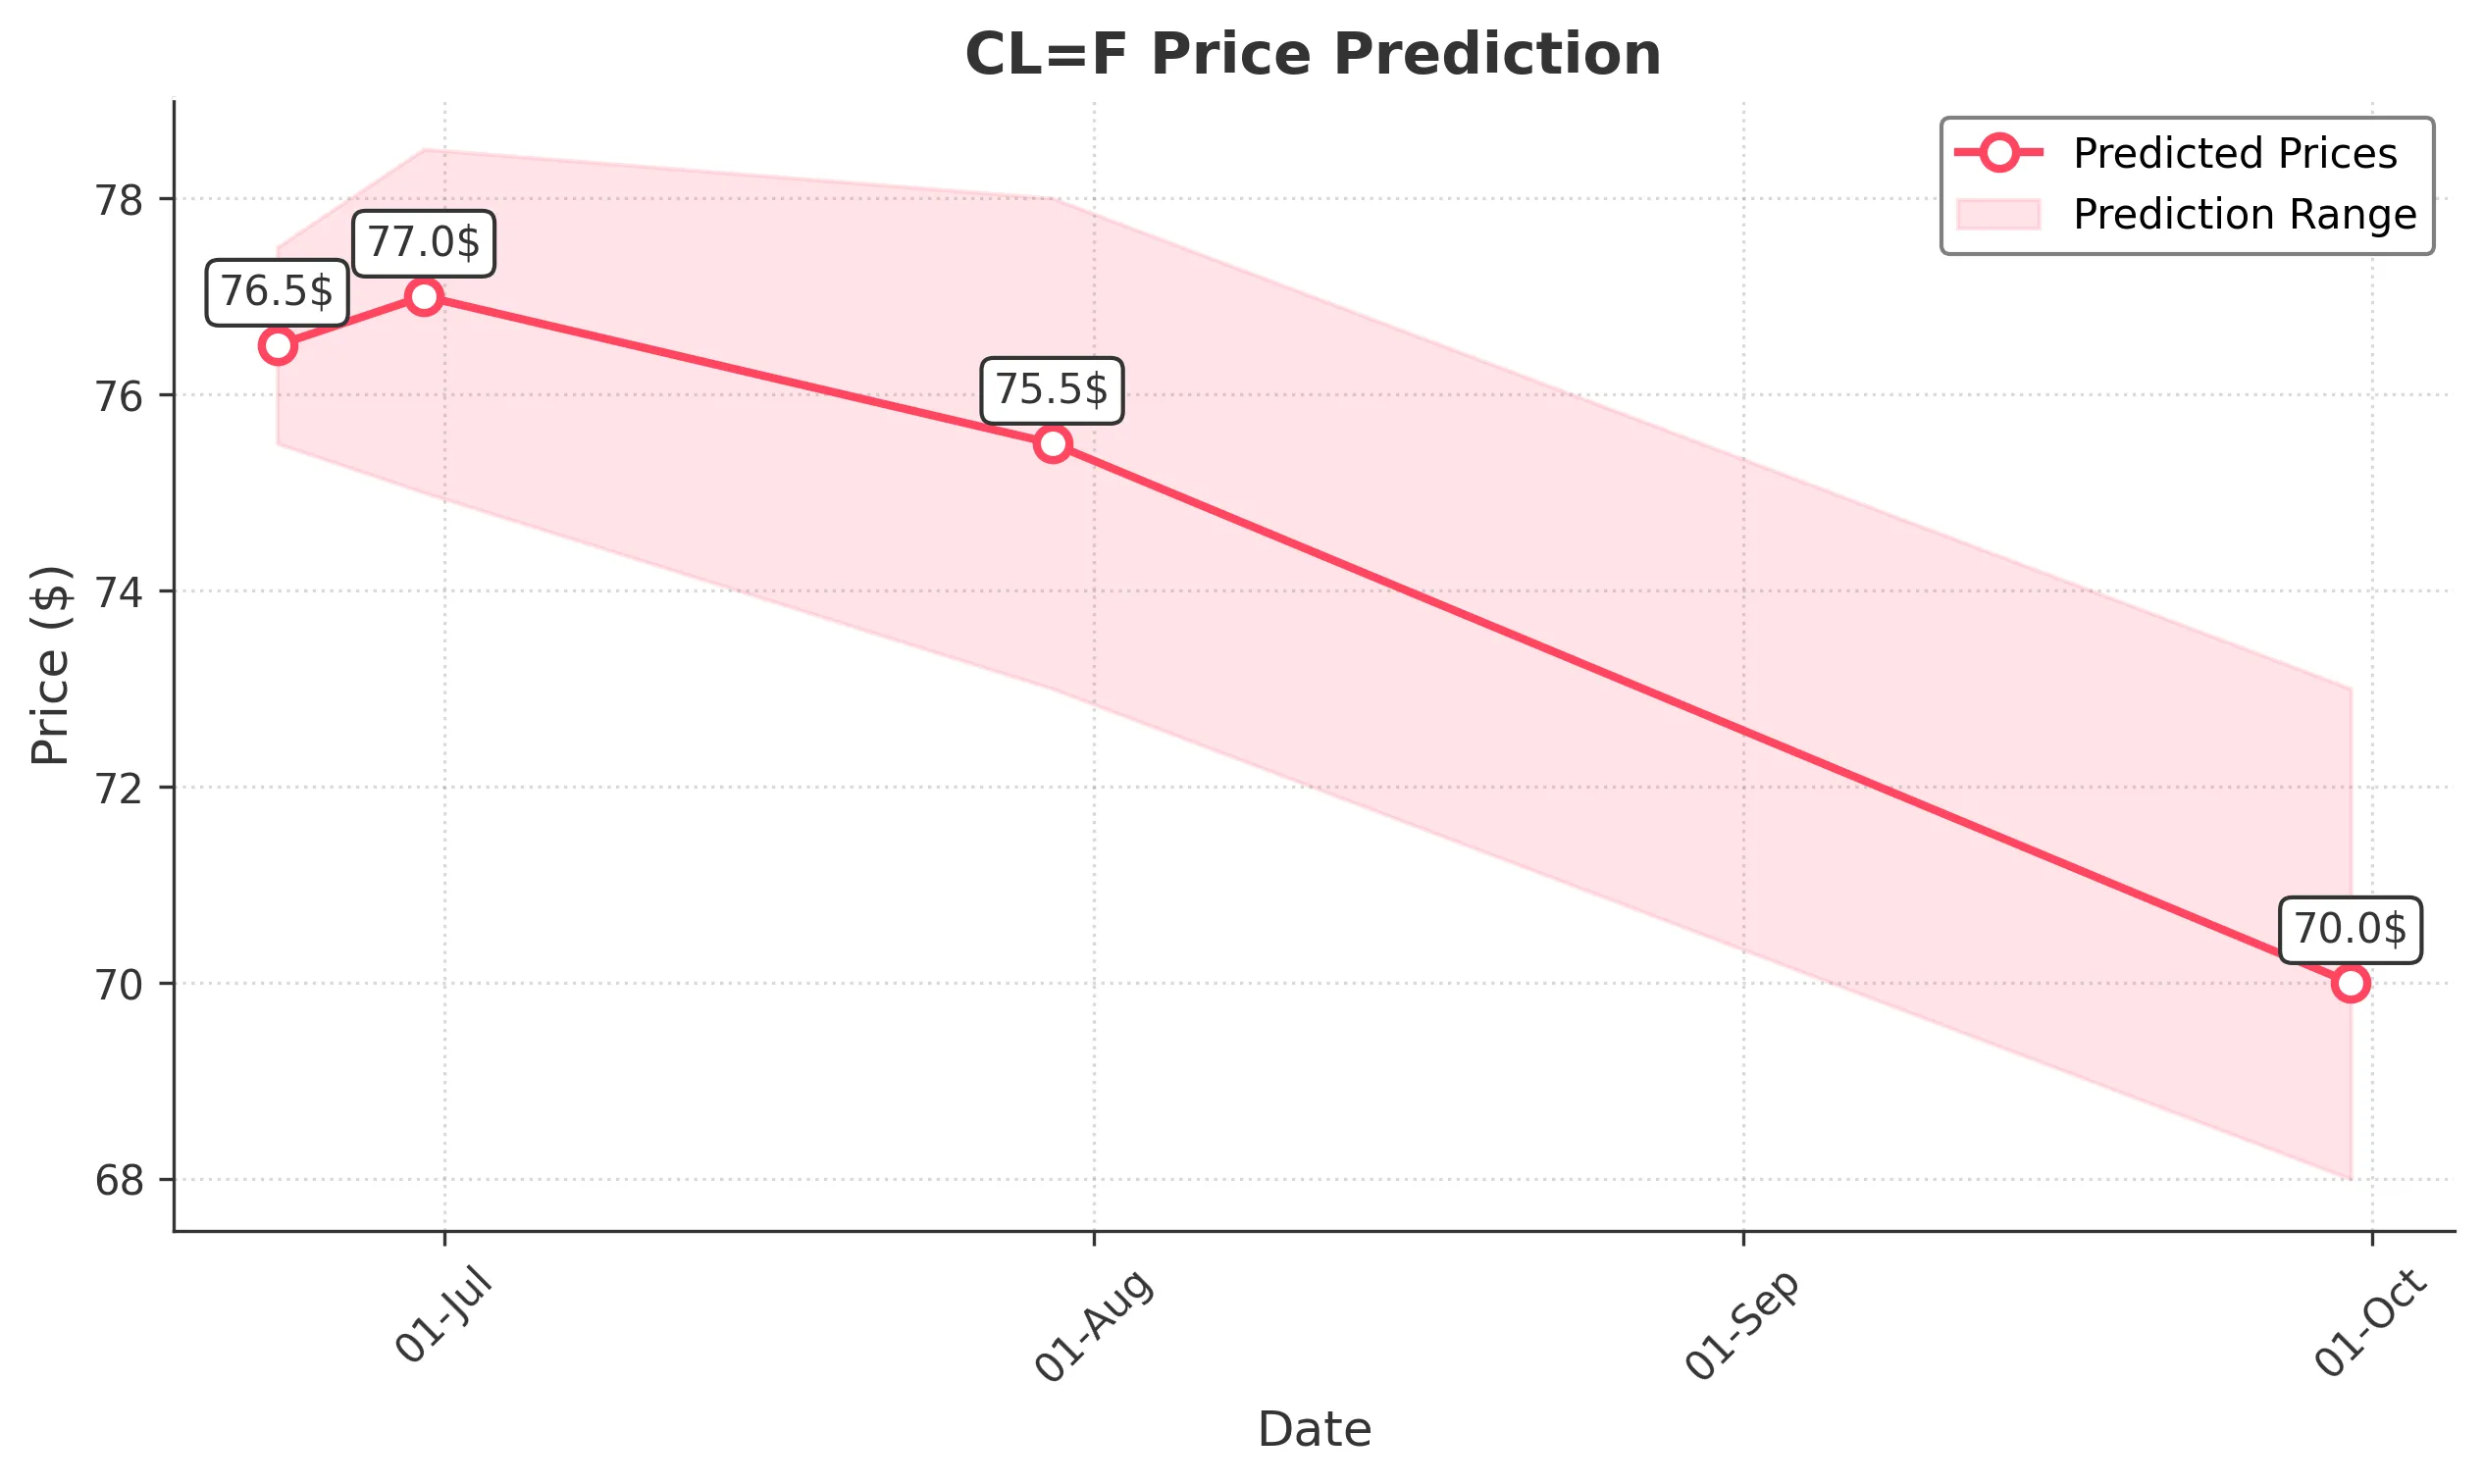
Target: June 23, 2025$76.5
$76.8
$77.5
$75.5
Description
The stock shows bullish momentum with a recent upward trend. The RSI is approaching overbought levels, indicating potential for a pullback. However, strong support at $75.00 and positive market sentiment suggest a close around $76.50.
Analysis
Over the past 3 months, CL=F has shown a bullish trend, especially after a significant rally in early June. Key resistance is at $78.00, while support is around $75.00. The MACD indicates upward momentum, but the RSI suggests caution as it nears overbought territory.
Confidence Level
Potential Risks
Potential volatility due to external market factors could impact the prediction.
1 Week Prediction
Target: June 30, 2025$77
$76.8
$78.5
$75
Description
The stock is expected to continue its upward trajectory, supported by strong buying volume. The Bollinger Bands indicate potential for a breakout above $78.00, but caution is advised as the RSI is high, suggesting a possible correction.
Analysis
CL=F has experienced significant volatility, with recent highs indicating strong bullish sentiment. The MACD remains positive, and volume spikes suggest increased interest. However, the stock is approaching overbought conditions, which could lead to a pullback.
Confidence Level
Potential Risks
Market corrections or negative news could lead to unexpected price movements.
1 Month Prediction
Target: July 30, 2025$75.5
$76
$78
$73
Description
Expect a slight pullback as the stock may face resistance at $78.00. The RSI indicates overbought conditions, and profit-taking could occur. However, strong support at $73.00 may prevent significant declines.
Analysis
The stock has shown a strong bullish trend but is now facing resistance. The ATR indicates increasing volatility, and the recent candlestick patterns suggest potential for a correction. Volume analysis shows a mix of buying and selling pressure.
Confidence Level
Potential Risks
Unforeseen macroeconomic events could impact market sentiment and stock performance.
3 Months Prediction
Target: September 30, 2025$70
$71
$73
$68
Description
A bearish outlook is anticipated as the stock may retrace towards $70.00 due to profit-taking and potential market corrections. The Fibonacci retracement levels suggest support at $68.00, which could be tested.
Analysis
Over the past three months, CL=F has shown strong bullish momentum but is now at risk of a correction. Key support levels are at $70.00 and $68.00, while resistance remains at $78.00. The market sentiment is mixed, with potential external factors influencing future performance.
Confidence Level
Potential Risks
Market volatility and economic indicators could lead to unexpected price movements.