OIL Trading Predictions
1 Day Prediction
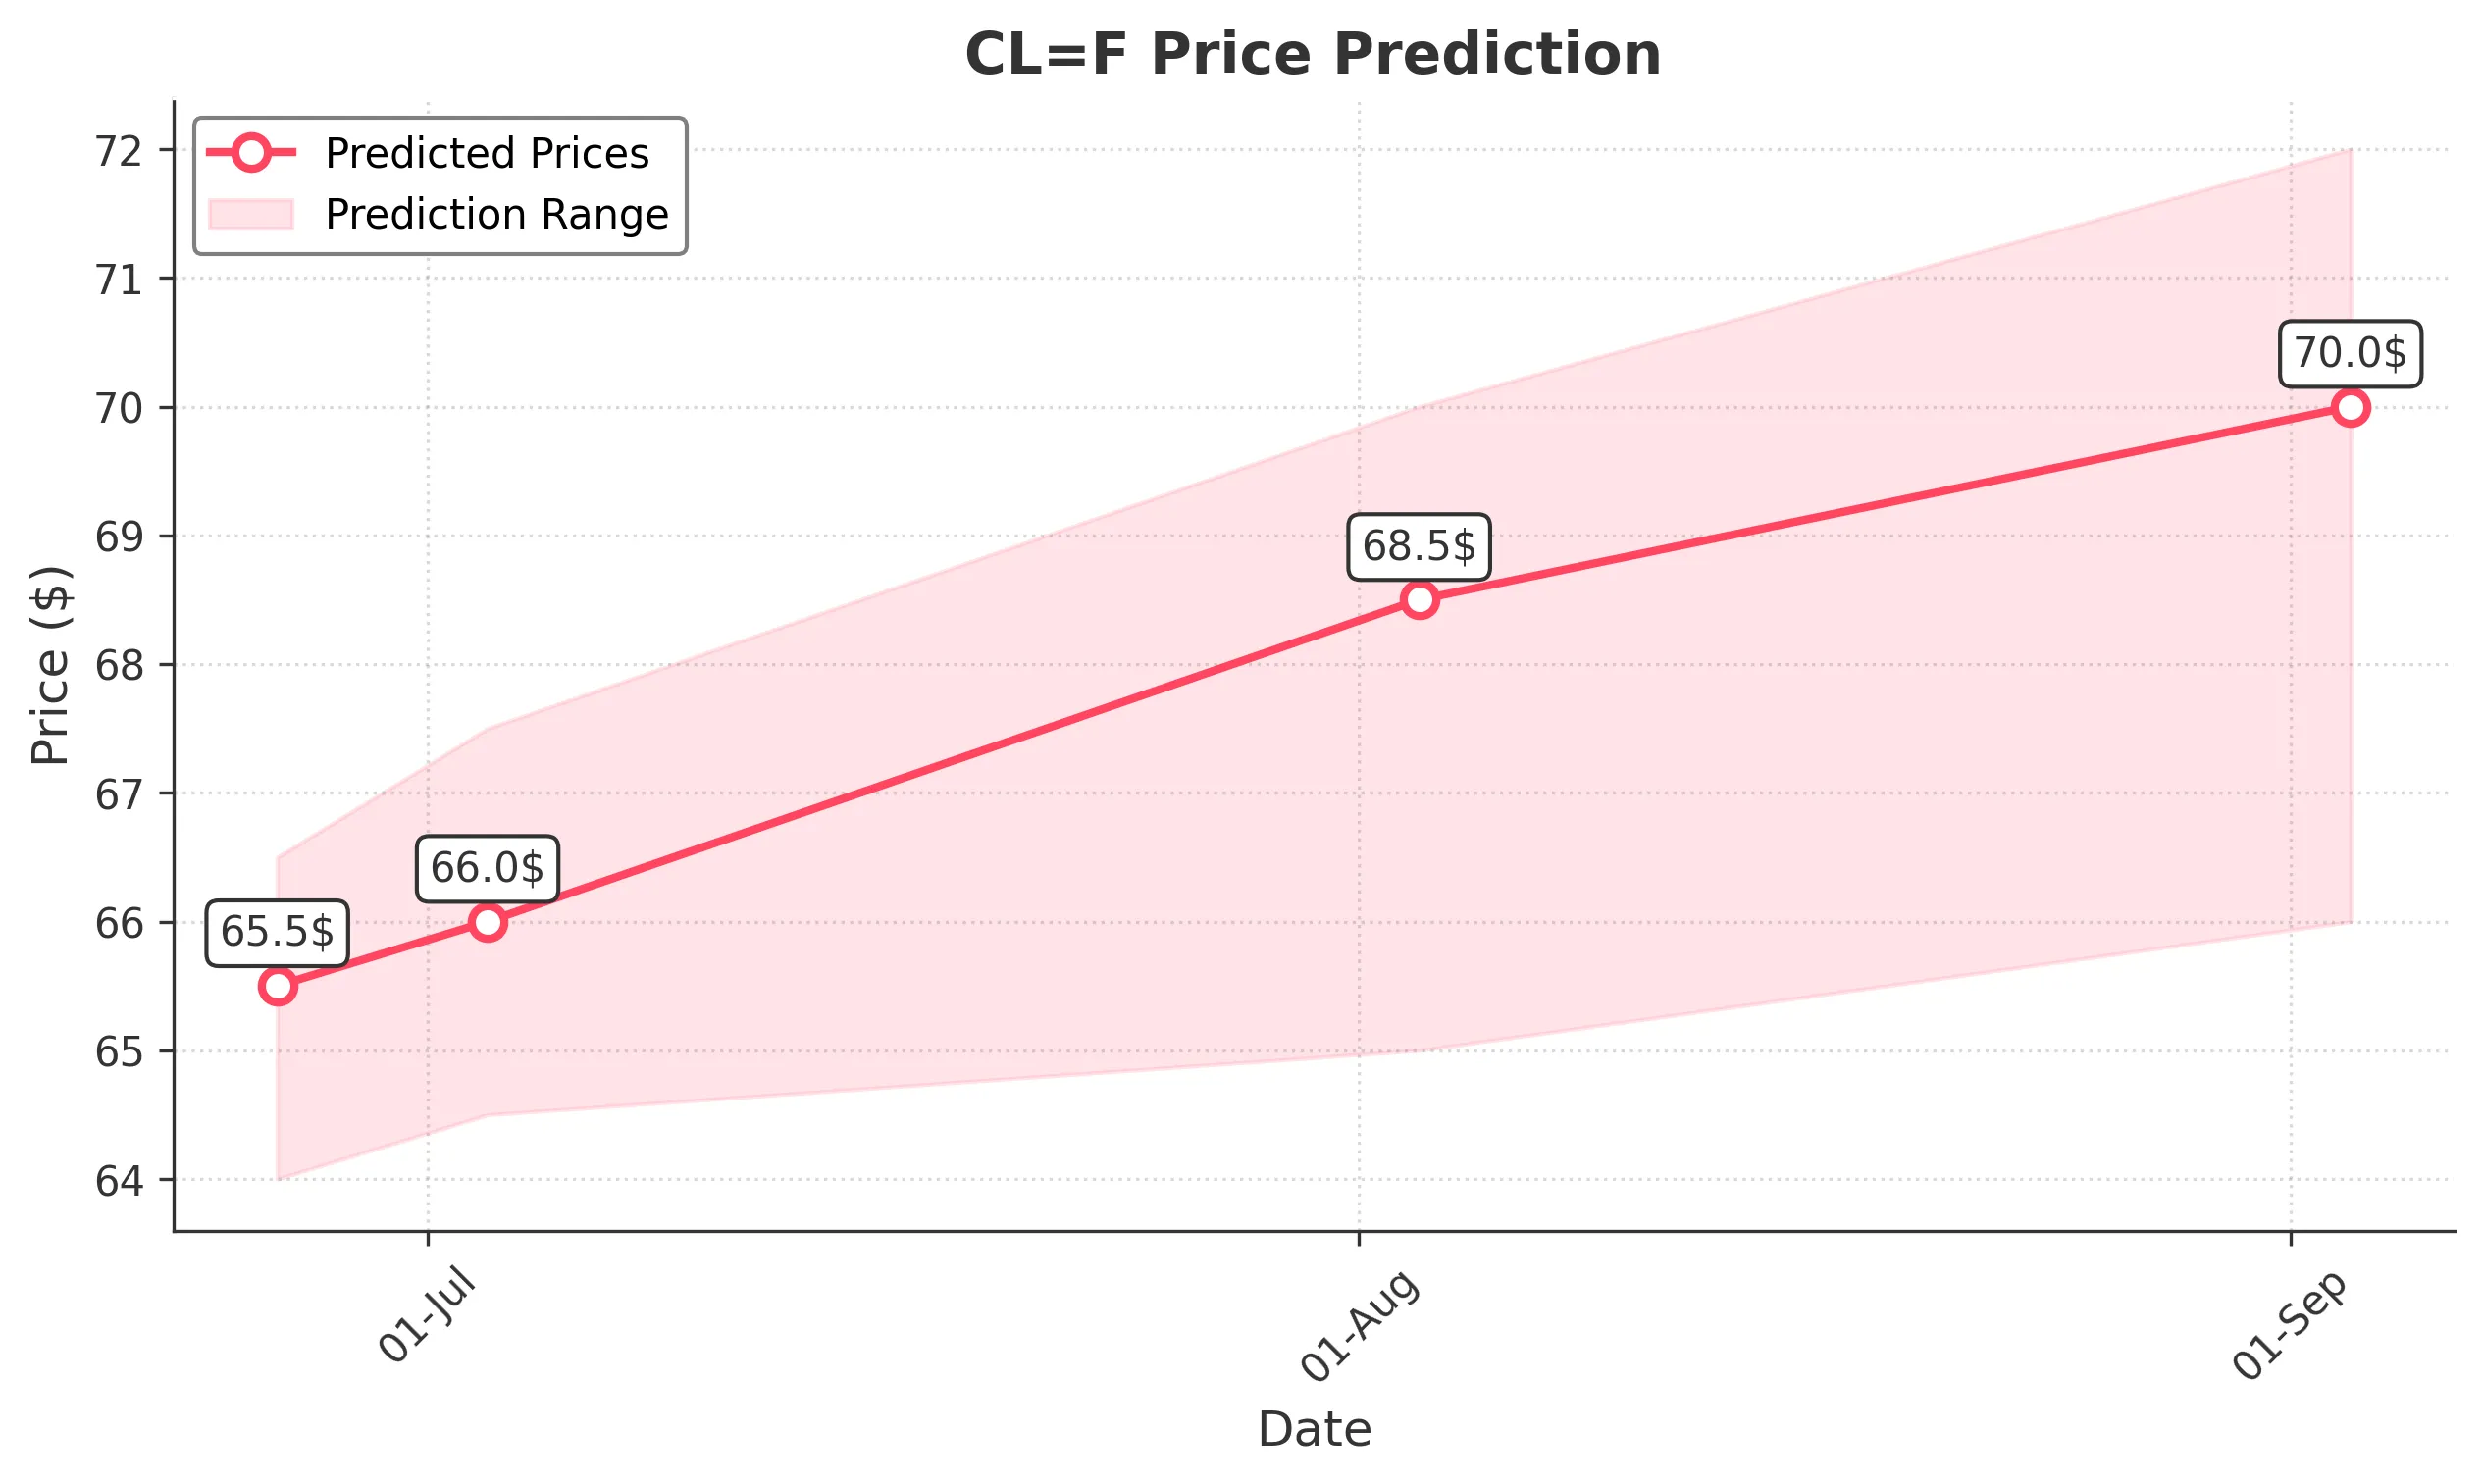
Target: June 26, 2025$65.5
$65
$66.5
$64
Description
The stock shows a slight bullish trend with a potential close around 65.50. The recent candlestick patterns indicate indecision, while the RSI is neutral. Volume is expected to be moderate, reflecting cautious sentiment.
Analysis
Over the past 3 months, CL=F has shown a bullish trend with significant highs around 72.98. However, recent price action indicates a potential pullback, with support at 64.00. The RSI is neutral, and volume has been inconsistent, suggesting uncertainty.
Confidence Level
Potential Risks
Market volatility and external news could impact the price. A bearish reversal is possible if selling pressure increases.
1 Week Prediction
Target: July 3, 2025$66
$65.75
$67.5
$64.5
Description
Expect a close around 66.00 as the stock may find support at recent lows. The MACD shows a potential bullish crossover, but the market sentiment remains cautious, which could limit upside.
Analysis
The stock has been volatile, with significant fluctuations. Key resistance is at 68.00, while support is at 64.00. The Bollinger Bands indicate tightening, suggesting a potential breakout or breakdown.
Confidence Level
Potential Risks
Potential for bearish news or economic data releases could lead to downward pressure. Watch for volume spikes indicating strong buying or selling.
1 Month Prediction
Target: August 3, 2025$68.5
$67
$70
$65
Description
A close around 68.50 is anticipated as the stock may recover from recent lows. The Fibonacci retracement levels suggest a potential bounce back, but market sentiment remains mixed.
Analysis
The stock has shown a mix of bullish and bearish signals. Recent highs indicate potential resistance at 70.00, while support at 65.00 is critical. The ATR suggests increased volatility, warranting caution.
Confidence Level
Potential Risks
Economic indicators and geopolitical events could sway market sentiment. A bearish trend could emerge if the stock fails to hold above 66.00.
3 Months Prediction
Target: September 3, 2025$70
$69
$72
$66
Description
A potential close of 70.00 reflects a bullish outlook if the stock can maintain momentum. The MACD indicates a bullish trend, but external factors could introduce volatility.
Analysis
The stock has experienced significant fluctuations, with a recent bullish trend. Key resistance levels are at 72.00, while support is at 66.00. The overall market sentiment is cautious, with potential for both upward and downward movements.
Confidence Level
Potential Risks
Unforeseen market events or economic downturns could reverse the trend. Watch for changes in volume and market sentiment.