OIL Trading Predictions
1 Day Prediction
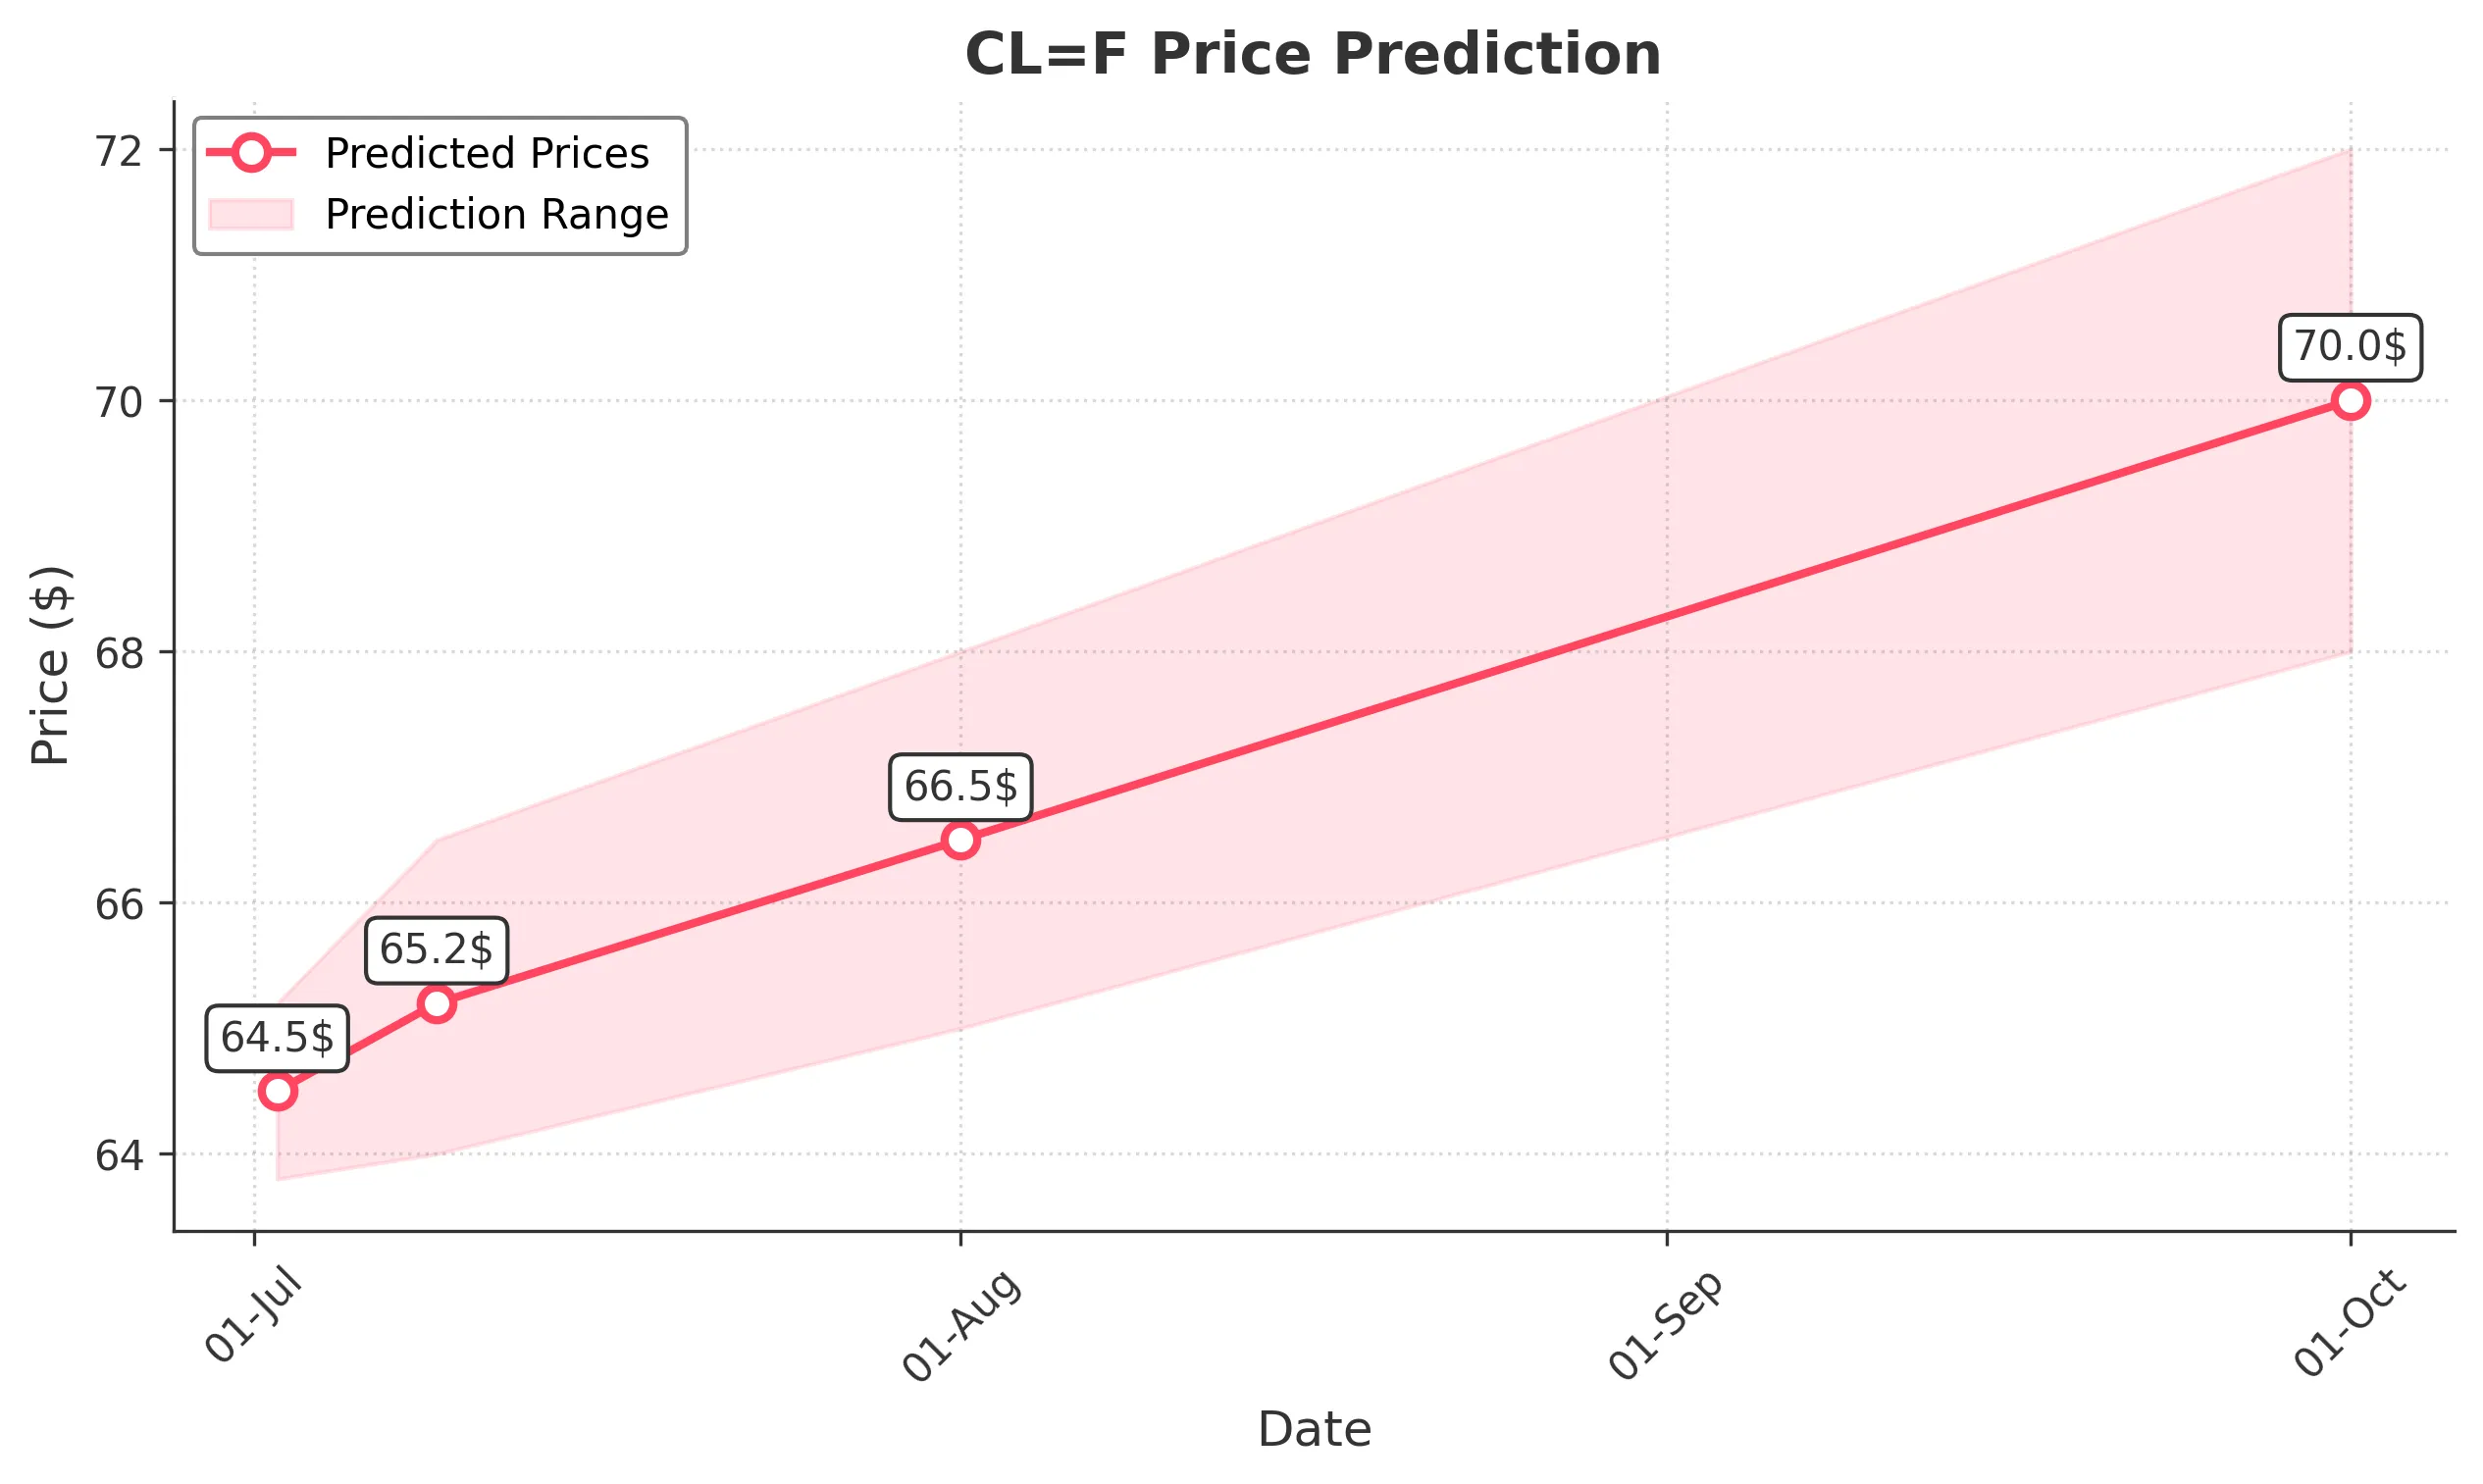
Target: July 2, 2025$64.5
$64.7
$65.2
$63.8
Description
The stock shows a slight bearish trend with recent lower highs and lower lows. RSI indicates oversold conditions, suggesting a potential bounce. However, MACD is bearish, indicating continued downward pressure. Volume remains low, indicating lack of strong buying interest.
Analysis
Over the past 3 months, CL=F has shown volatility with a bearish trend recently. Key support at 64.00 and resistance at 66.00. RSI is nearing oversold levels, while MACD indicates bearish momentum. Volume has been inconsistent, suggesting uncertainty in market sentiment.
Confidence Level
Potential Risks
Market sentiment could shift quickly due to macroeconomic news or earnings reports, which may impact the prediction.
1 Week Prediction
Target: July 9, 2025$65.2
$64.8
$66.5
$64
Description
A potential recovery is indicated as the stock approaches key support levels. The RSI may recover from oversold conditions, and a bullish divergence could form. However, MACD remains bearish, suggesting caution. Volume may increase as traders react to price movements.
Analysis
The stock has been in a bearish phase, with significant fluctuations. Support at 64.00 is critical, while resistance at 66.00 may limit upward movement. Technical indicators show mixed signals, with potential for a short-term bounce but overall bearish sentiment persists.
Confidence Level
Potential Risks
Unforeseen market events or economic data releases could lead to volatility, impacting the accuracy of this prediction.
1 Month Prediction
Target: August 1, 2025$66.5
$65.8
$68
$65
Description
A gradual recovery is anticipated as the stock stabilizes near support levels. RSI may improve, indicating a potential bullish reversal. However, MACD remains a concern. Volume may increase as traders react to market conditions and earnings reports.
Analysis
The stock has shown a bearish trend with recent fluctuations. Key support at 64.00 and resistance at 68.00. Technical indicators suggest potential for recovery, but overall market sentiment remains cautious. Volume patterns indicate uncertainty among traders.
Confidence Level
Potential Risks
Market volatility and external economic factors could hinder recovery, leading to unexpected price movements.
3 Months Prediction
Target: October 1, 2025$70
$69.5
$72
$68
Description
Long-term recovery is expected as the stock may break through resistance levels. Positive market sentiment and potential bullish patterns could emerge. However, macroeconomic factors and earnings reports will play a significant role in price movements.
Analysis
The stock has experienced significant volatility with a bearish trend recently. Key resistance at 72.00 and support at 64.00. Technical indicators suggest potential for recovery, but external factors could impact performance. Overall, a cautious outlook is warranted.
Confidence Level
Potential Risks
Economic conditions and market sentiment could shift, leading to unexpected volatility and affecting the prediction's accuracy.