OIL Trading Predictions
1 Day Prediction
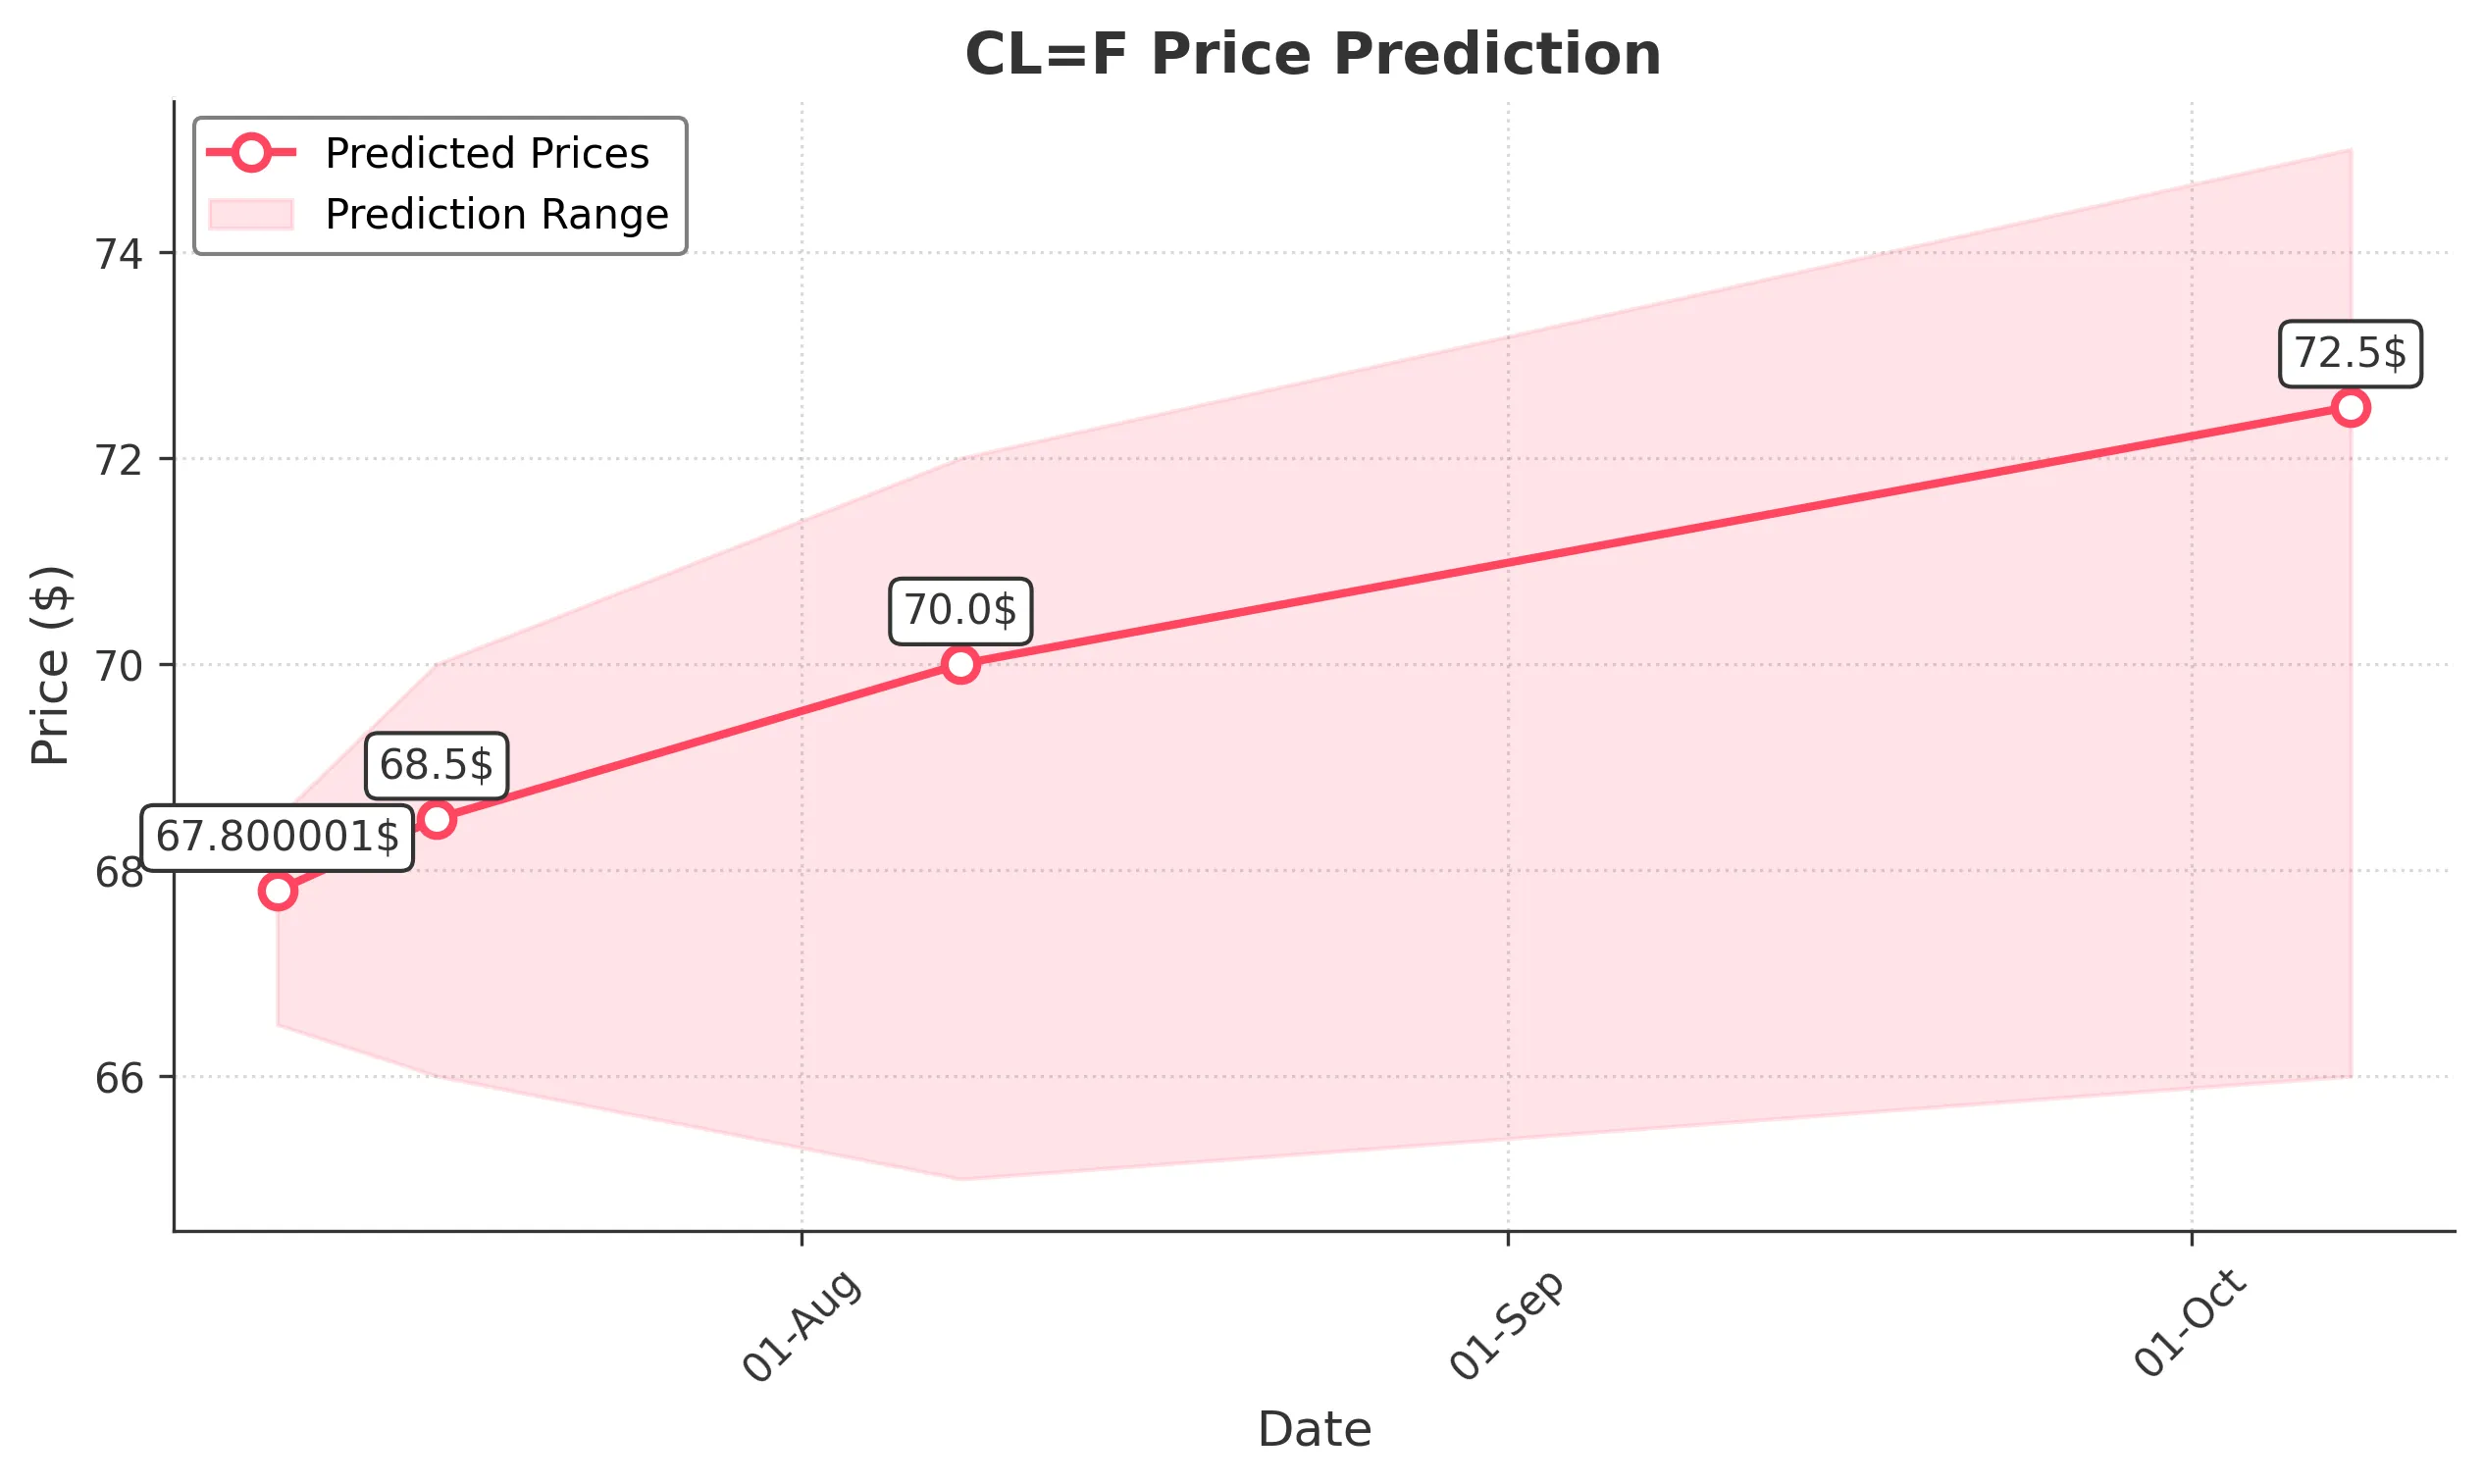
Target: July 9, 2025$67.800001
$67.5
$68.5
$66.5
Description
The stock shows a bullish trend with a recent upward movement. The RSI is approaching overbought levels, indicating potential for a pullback. However, the MACD remains positive, suggesting continued momentum. Expect slight fluctuations around the current price.
Analysis
Over the past 3 months, CL=F has shown a bullish trend, with significant upward movements. Key resistance is around 68.00, while support is at 65.00. The MACD indicates bullish momentum, but the RSI suggests overbought conditions, which could lead to a pullback.
Confidence Level
Potential Risks
Potential market volatility and profit-taking could lead to a price drop.
1 Week Prediction
Target: July 16, 2025$68.5
$67.800001
$70
$66
Description
The stock is expected to continue its upward trajectory, supported by strong buying volume. The Bollinger Bands indicate potential for a breakout. However, the RSI is nearing overbought territory, which may lead to short-term corrections.
Analysis
CL=F has been on a bullish run, with recent highs indicating strong demand. The MACD remains positive, and volume patterns suggest sustained interest. Key resistance at 70.00 may pose challenges, while support at 66.00 is crucial for maintaining upward momentum.
Confidence Level
Potential Risks
Market sentiment could shift due to external economic factors, impacting the stock's performance.
1 Month Prediction
Target: August 8, 2025$70
$68.5
$72
$65
Description
The stock is projected to reach new highs as bullish sentiment persists. The Fibonacci retracement levels suggest a target around 70.00. However, the RSI indicates potential overbought conditions, which could lead to corrections.
Analysis
In the last 3 months, CL=F has shown strong bullish trends, with significant resistance at 70.00. The MACD supports continued upward movement, but the RSI indicates caution. Volume spikes suggest strong interest, but external factors could impact future performance.
Confidence Level
Potential Risks
Economic data releases and geopolitical events could introduce volatility, affecting price stability.
3 Months Prediction
Target: October 8, 2025$72.5
$70
$75
$66
Description
Long-term bullish outlook as the stock is expected to break through resistance levels. The MACD and moving averages indicate sustained upward momentum. However, potential market corrections could occur if the RSI remains overbought.
Analysis
CL=F has experienced significant price increases over the past 3 months, with key resistance at 75.00. The MACD and moving averages suggest bullish momentum, but the RSI indicates potential overbought conditions. External economic factors could influence future price movements.
Confidence Level
Potential Risks
Long-term predictions are subject to market volatility and economic changes that could alter trends.