OIL Trading Predictions
1 Day Prediction
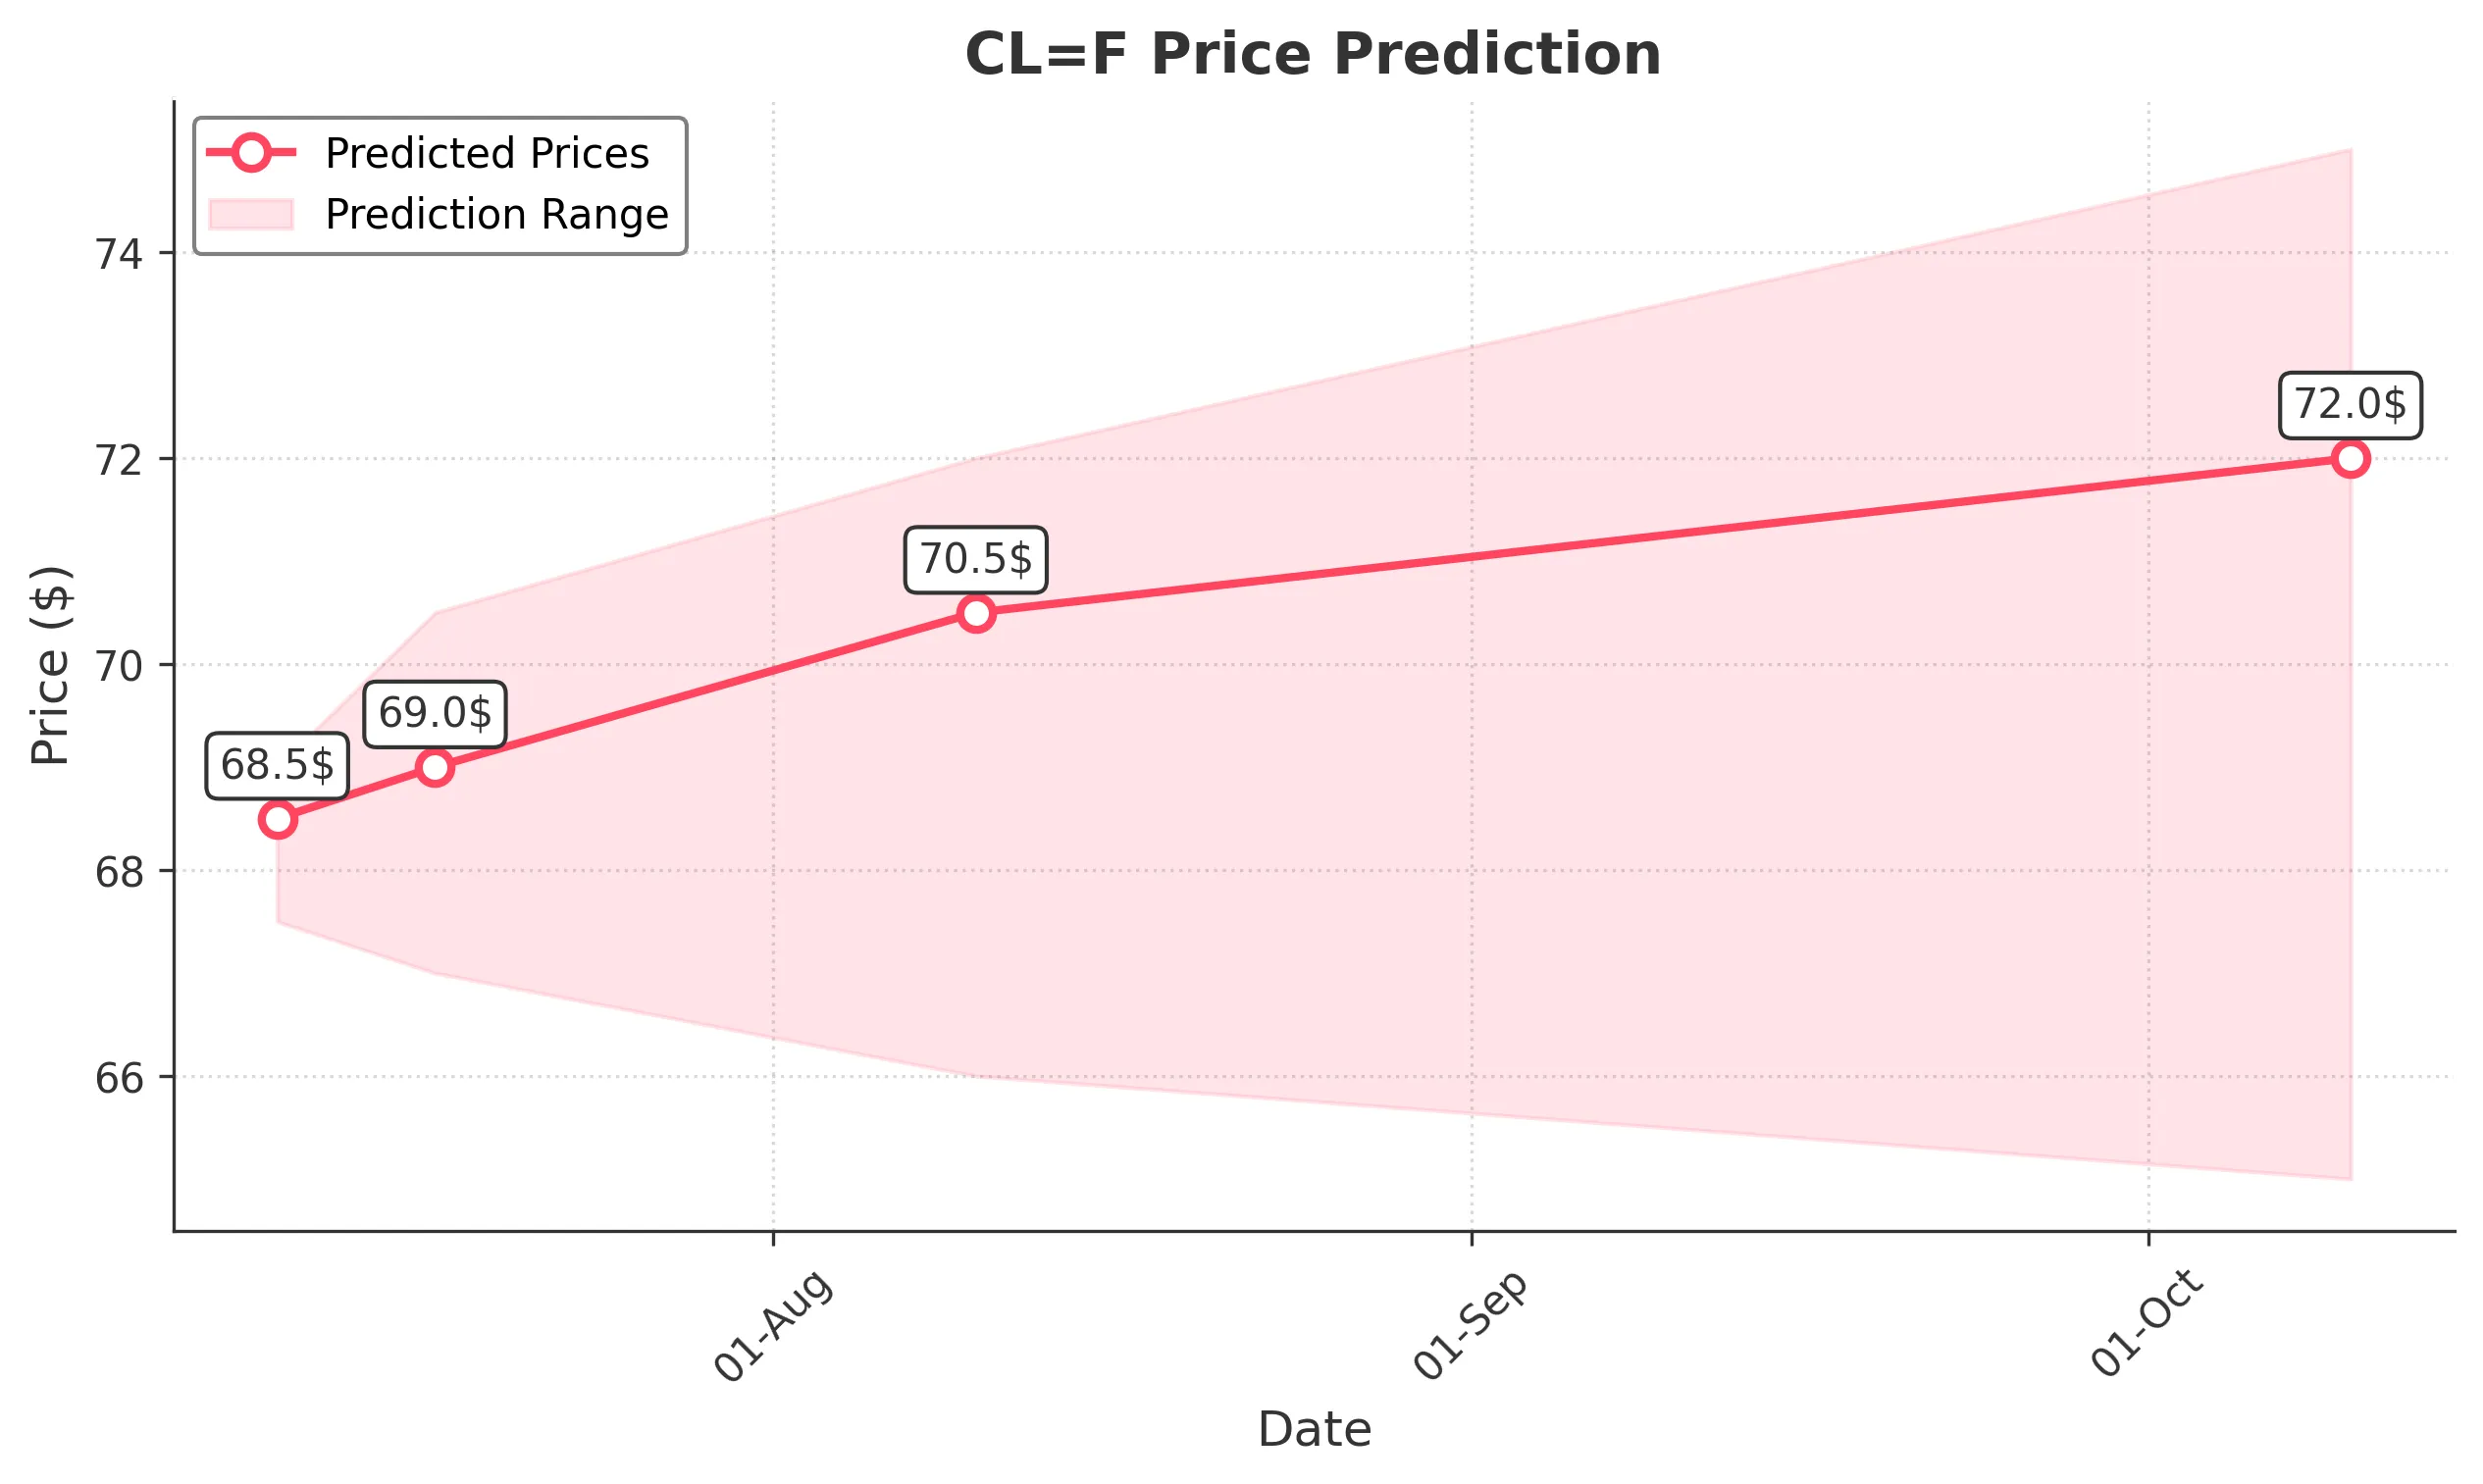
Target: July 10, 2025$68.5
$68.2
$69
$67.5
Description
The stock shows bullish momentum with a recent upward trend. The RSI is approaching overbought levels, indicating potential for a pullback. However, strong buying pressure may push the price higher in the short term.
Analysis
Over the past 3 months, CL=F has shown a bullish trend, with significant support at $65. The recent price action indicates strong buying interest, but RSI nearing overbought levels suggests caution. Volume has been stable, indicating healthy trading activity.
Confidence Level
Potential Risks
Potential for a reversal if market sentiment shifts or if external news impacts trading.
1 Week Prediction
Target: July 17, 2025$69
$68.8
$70.5
$67
Description
The stock is expected to continue its upward trajectory, supported by recent bullish candlestick patterns. However, the MACD shows signs of potential divergence, which could indicate a weakening trend.
Analysis
CL=F has been in a bullish phase, with resistance around $70. The MACD is positive, but divergence signals caution. Volume spikes on up days suggest strong interest, while recent candlestick patterns indicate potential for further gains.
Confidence Level
Potential Risks
Market volatility and external economic factors could impact the price direction.
1 Month Prediction
Target: August 10, 2025$70.5
$69.5
$72
$66
Description
The stock is likely to test higher resistance levels as bullish sentiment persists. However, the RSI indicates overbought conditions, suggesting a possible correction in the near term.
Analysis
The stock has shown a strong upward trend, with key support at $66. The RSI is high, indicating potential for a pullback. Volume trends remain positive, but external factors could introduce uncertainty in the coming month.
Confidence Level
Potential Risks
Economic data releases and geopolitical events could lead to increased volatility.
3 Months Prediction
Target: October 10, 2025$72
$70
$75
$65
Description
Long-term bullish outlook supported by strong fundamentals and market sentiment. However, potential resistance at $75 may limit upside, and macroeconomic factors could introduce volatility.
Analysis
Over the last three months, CL=F has shown a bullish trend with significant resistance at $75. The stock's performance is influenced by broader market conditions and economic indicators. While the outlook remains positive, caution is warranted due to potential volatility.
Confidence Level
Potential Risks
Unforeseen economic events or changes in market sentiment could lead to significant price fluctuations.