OIL Trading Predictions
1 Day Prediction
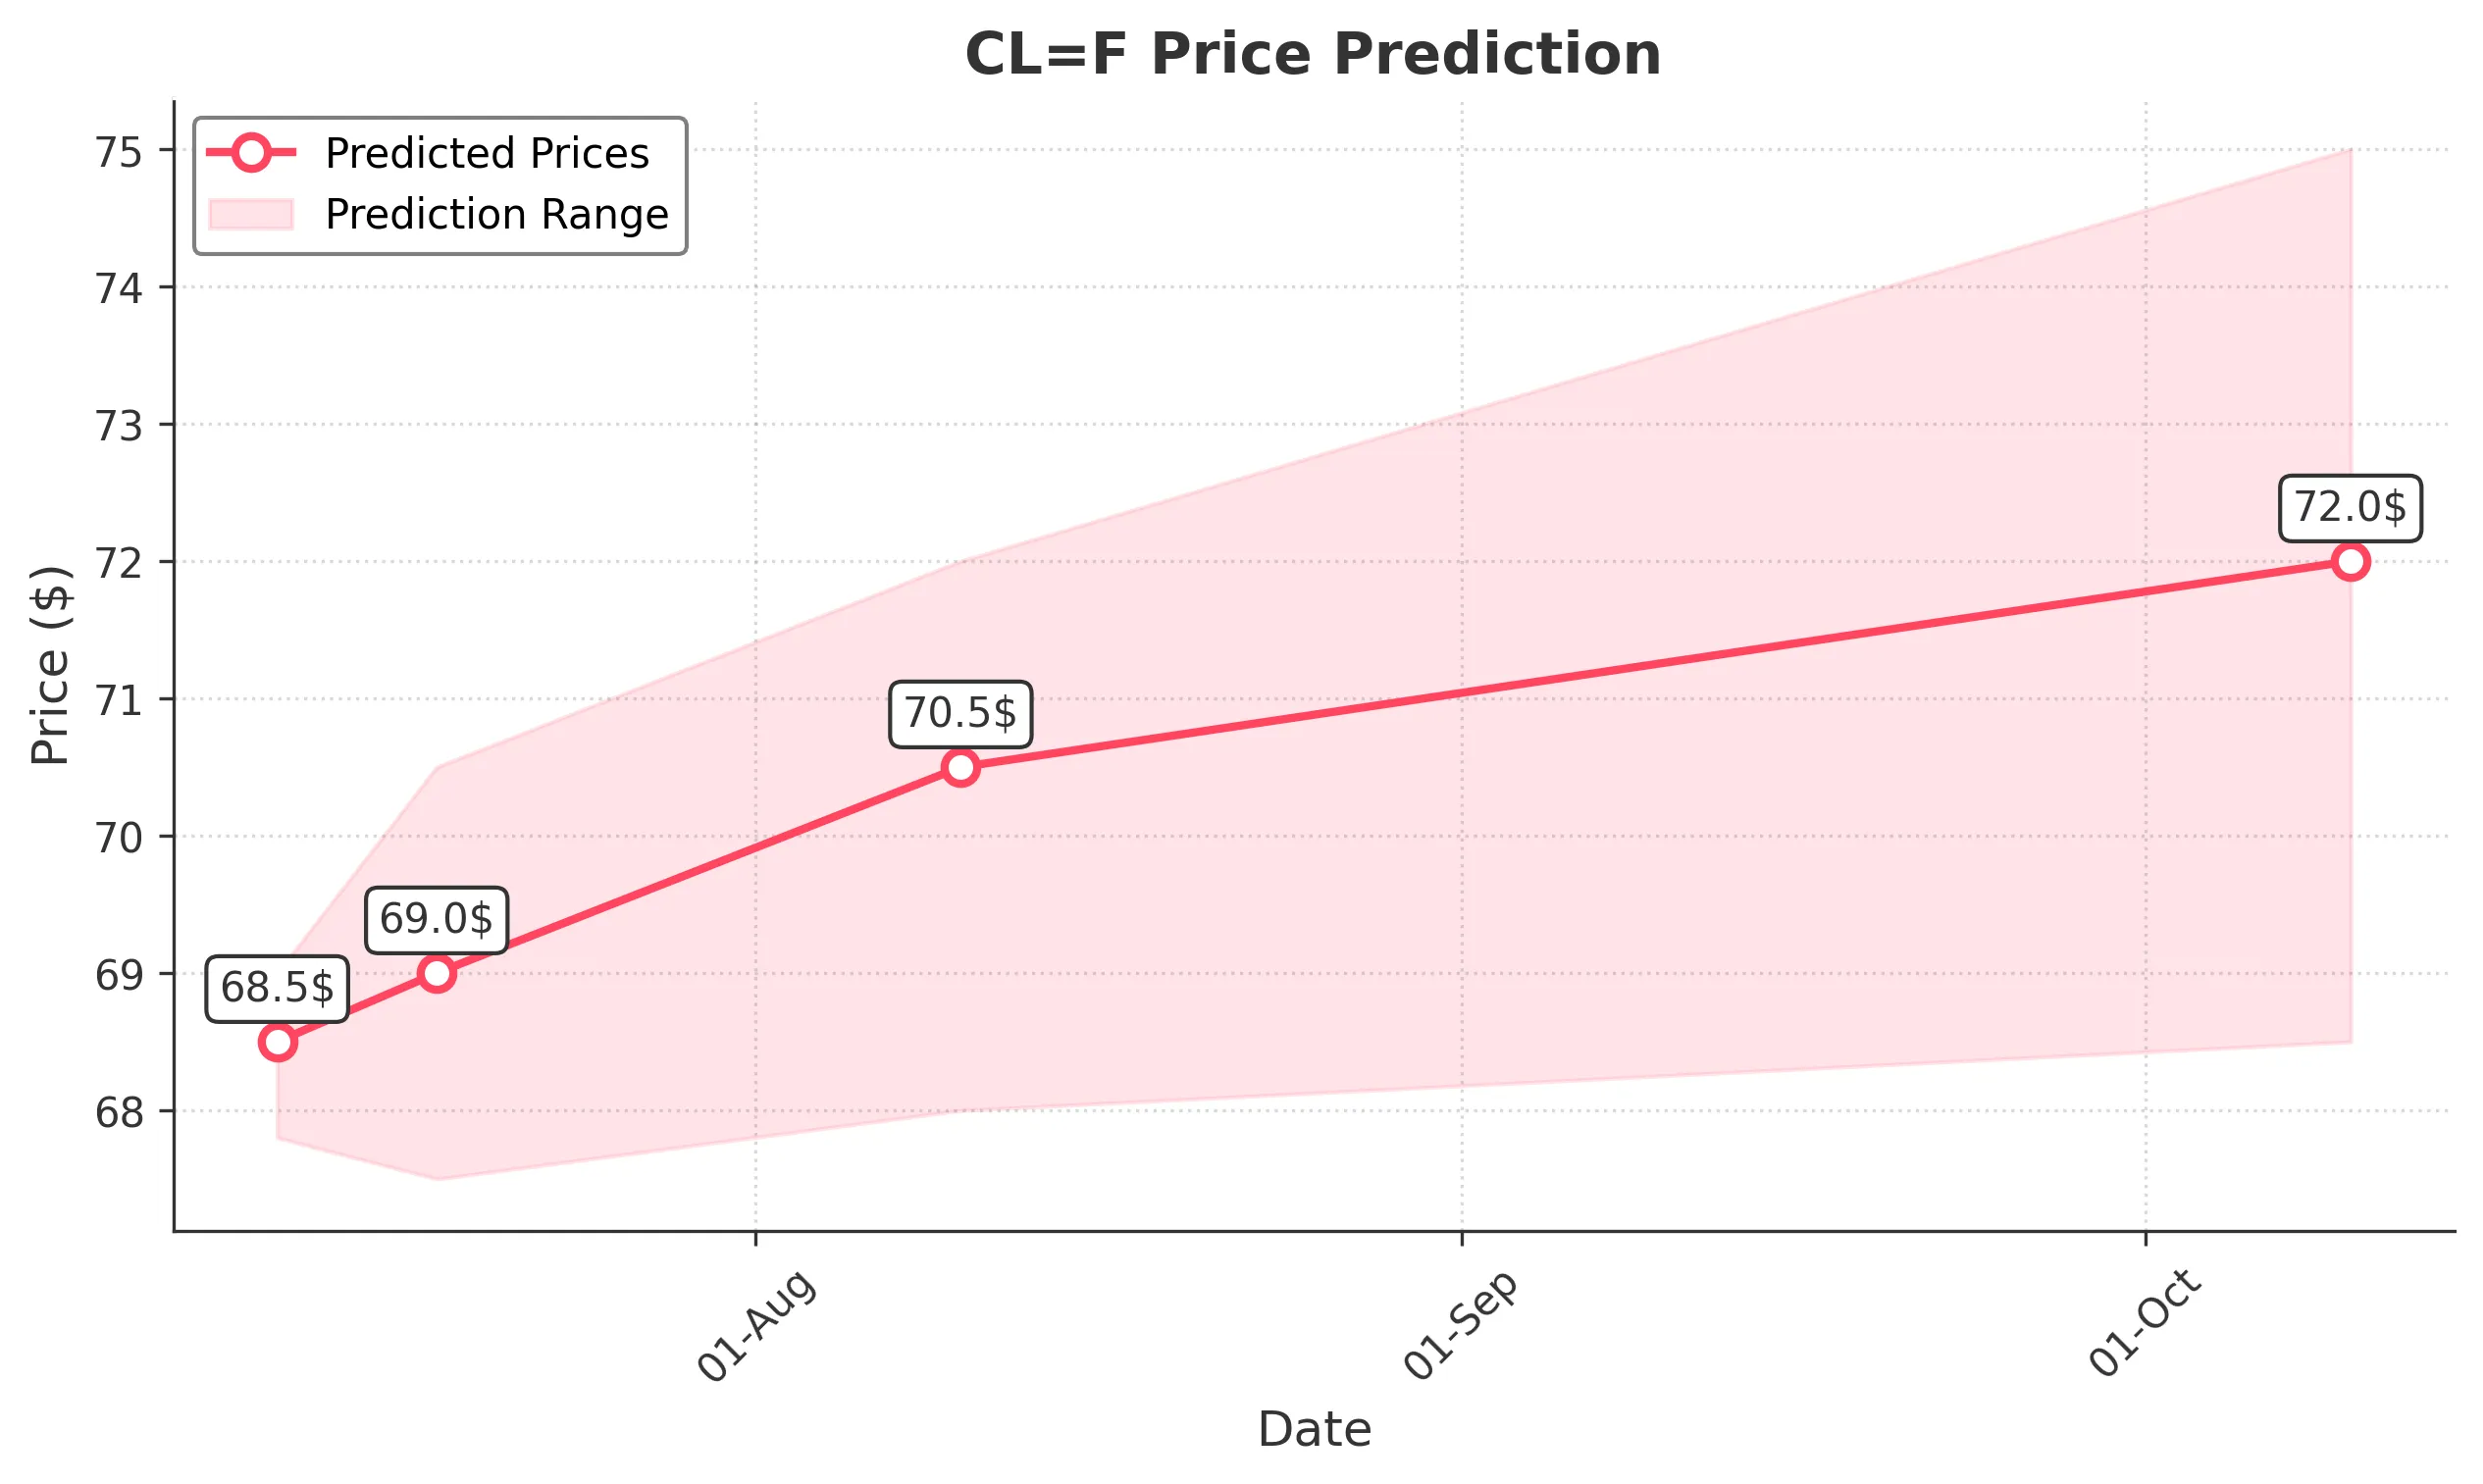
Target: July 11, 2025$68.5
$68.4
$69
$67.8
Description
The stock shows a bullish trend with a recent upward movement. The RSI is approaching overbought levels, indicating potential for a pullback. However, the MACD remains positive, suggesting continued upward momentum. Volume is expected to stabilize around average levels.
Analysis
Over the past 3 months, CL=F has shown a bullish trend, with significant support at $67.00 and resistance at $70.00. The recent price action indicates strong buying interest, but the RSI nearing overbought levels suggests caution. Volume has been consistent, with some spikes indicating strong interest.
Confidence Level
Potential Risks
Potential market volatility and profit-taking could lead to a reversal.
1 Week Prediction
Target: July 18, 2025$69
$68.8
$70.5
$67.5
Description
The stock is expected to continue its upward trajectory, supported by bullish sentiment and positive technical indicators. The MACD remains bullish, and the price is likely to test resistance at $70.00. However, caution is advised as the RSI indicates overbought conditions.
Analysis
The stock has been in a bullish phase, with key support at $67.00 and resistance at $70.00. The MACD and moving averages indicate a strong upward trend, but the RSI suggests potential overbought conditions. Volume patterns show healthy trading activity, but external factors could introduce volatility.
Confidence Level
Potential Risks
Market corrections or negative news could impact the upward trend.
1 Month Prediction
Target: August 10, 2025$70.5
$69.5
$72
$68
Description
The stock is projected to reach higher levels as bullish momentum persists. The MACD remains positive, and the price is likely to break through resistance at $70.00. However, the RSI indicates potential overbought conditions, suggesting a possible pullback.
Analysis
CL=F has shown a strong bullish trend with significant support at $67.00 and resistance at $70.00. The MACD and moving averages support continued upward movement, but the RSI nearing overbought levels raises concerns about sustainability. Volume trends indicate strong interest, but external factors could introduce risk.
Confidence Level
Potential Risks
Market sentiment shifts or economic news could lead to unexpected volatility.
3 Months Prediction
Target: October 10, 2025$72
$71
$75
$68.5
Description
The stock is expected to maintain an upward trend, potentially reaching $75.00. The MACD remains bullish, and the price action suggests strong buying interest. However, the RSI indicates overbought conditions, which could lead to corrections.
Analysis
Over the past 3 months, CL=F has demonstrated a bullish trend with key support at $67.00 and resistance at $75.00. The MACD and moving averages indicate a strong upward trajectory, but the RSI suggests potential overbought conditions. Volume patterns show consistent interest, but external factors could introduce volatility.
Confidence Level
Potential Risks
Economic changes or geopolitical events could significantly impact market conditions.