OIL Trading Predictions
1 Day Prediction
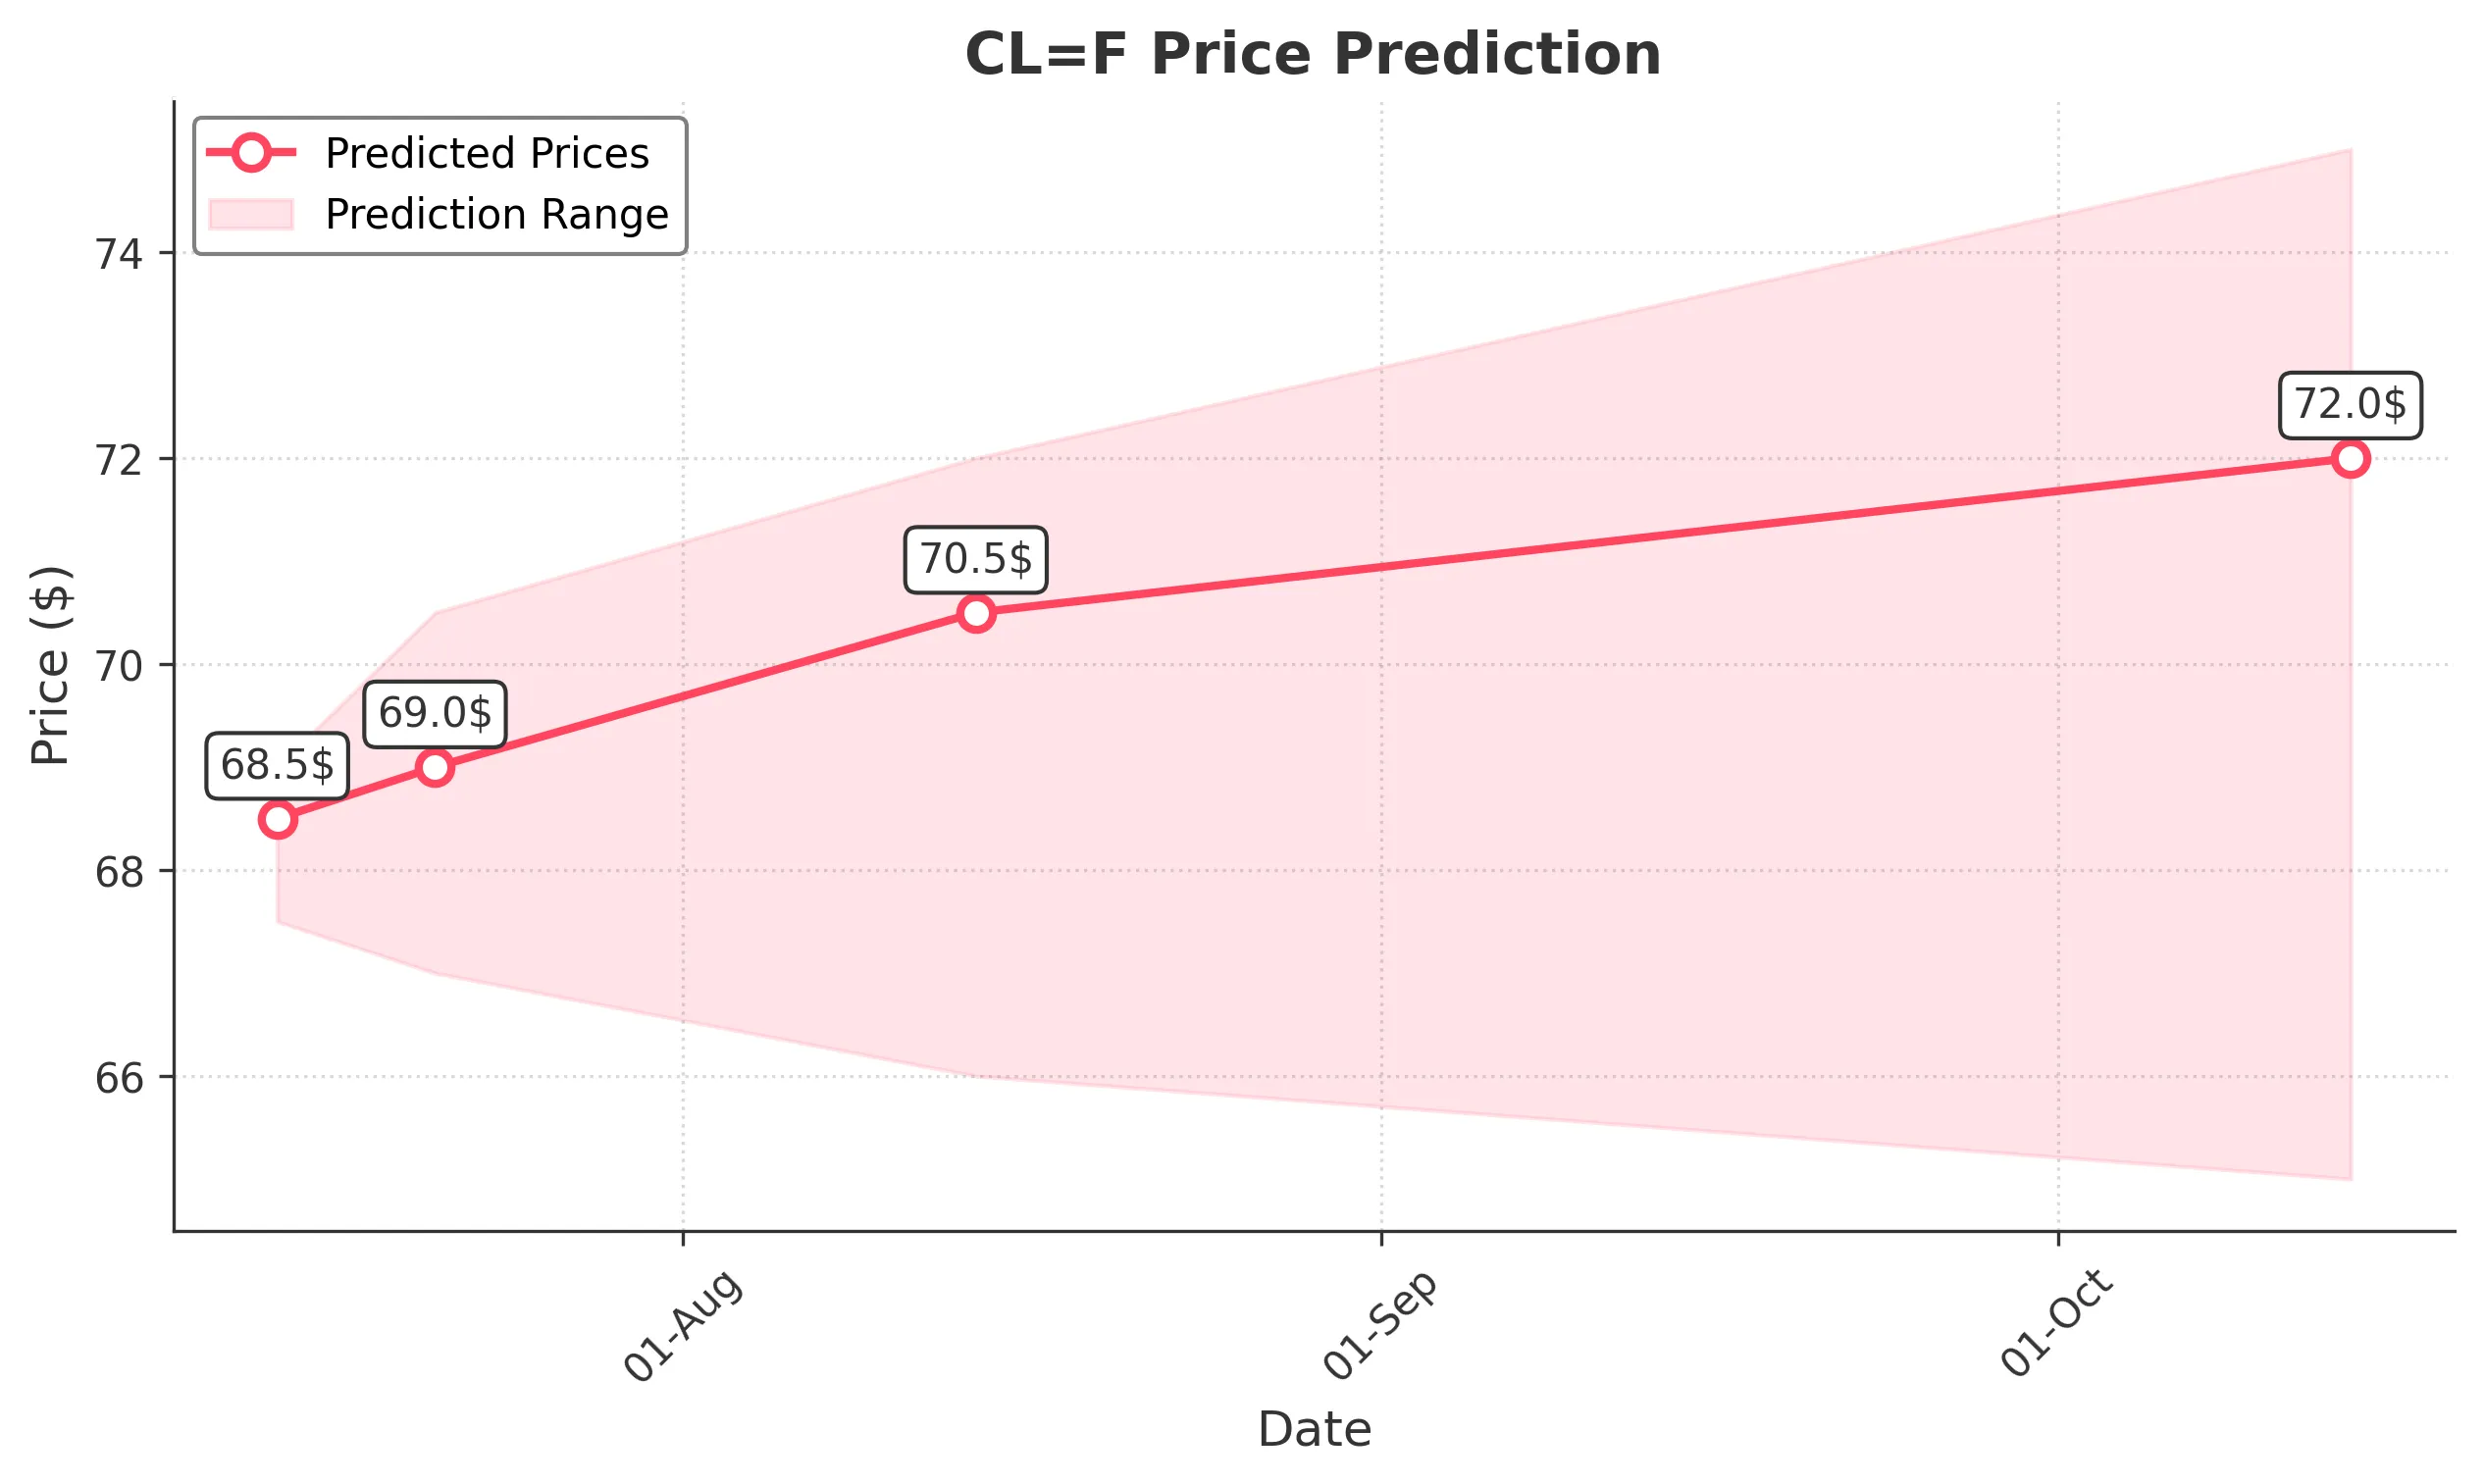
Target: July 14, 2025$68.5
$68.3
$69
$67.5
Description
The stock shows a bullish trend with a recent upward movement. The RSI is approaching overbought levels, indicating potential for a pullback. However, strong support at 67.00 suggests limited downside risk. Volume remains stable, supporting the upward momentum.
Analysis
Over the past 3 months, CL=F has shown a bullish trend, with significant upward movements and a recent peak at 72.98. Key support is at 67.00, while resistance is around 75.00. The MACD indicates bullish momentum, but the RSI suggests caution as it nears overbought territory.
Confidence Level
Potential Risks
Potential market volatility and profit-taking could lead to a sudden price drop.
1 Week Prediction
Target: July 21, 2025$69
$68.8
$70.5
$67
Description
The stock is expected to continue its upward trajectory, supported by recent bullish candlestick patterns. However, the RSI indicates overbought conditions, suggesting a possible pullback. Volume trends are stable, indicating sustained interest.
Analysis
CL=F has experienced a strong bullish phase, with recent highs indicating strong buying interest. The MACD remains positive, and the ATR suggests moderate volatility. Key resistance is at 70.00, while support is at 67.00, providing a balanced outlook.
Confidence Level
Potential Risks
Market sentiment could shift due to external economic factors, impacting the stock's performance.
1 Month Prediction
Target: August 14, 2025$70.5
$69
$72
$66
Description
The stock is likely to reach new highs, driven by strong market sentiment and bullish technical indicators. However, the RSI suggests potential overbought conditions, which could lead to a correction. Volume trends indicate sustained interest.
Analysis
In the last three months, CL=F has shown a clear bullish trend, with significant price increases. The MACD indicates continued bullish momentum, while the RSI suggests caution. Key support is at 66.00, and resistance is at 72.00, indicating potential for upward movement but with risks.
Confidence Level
Potential Risks
Economic data releases and geopolitical events could introduce volatility, affecting price stability.
3 Months Prediction
Target: October 14, 2025$72
$70
$75
$65
Description
The stock is expected to maintain an upward trend, supported by strong fundamentals and market sentiment. However, potential resistance at 75.00 may limit upside. The RSI indicates overbought conditions, suggesting a possible correction.
Analysis
CL=F has shown a strong bullish trend over the past three months, with significant price increases. The MACD remains positive, indicating bullish momentum, while the RSI suggests caution. Key support is at 65.00, and resistance is at 75.00, indicating potential for upward movement but with risks.
Confidence Level
Potential Risks
Market corrections and external economic factors could lead to increased volatility and price fluctuations.