OIL Trading Predictions
1 Day Prediction
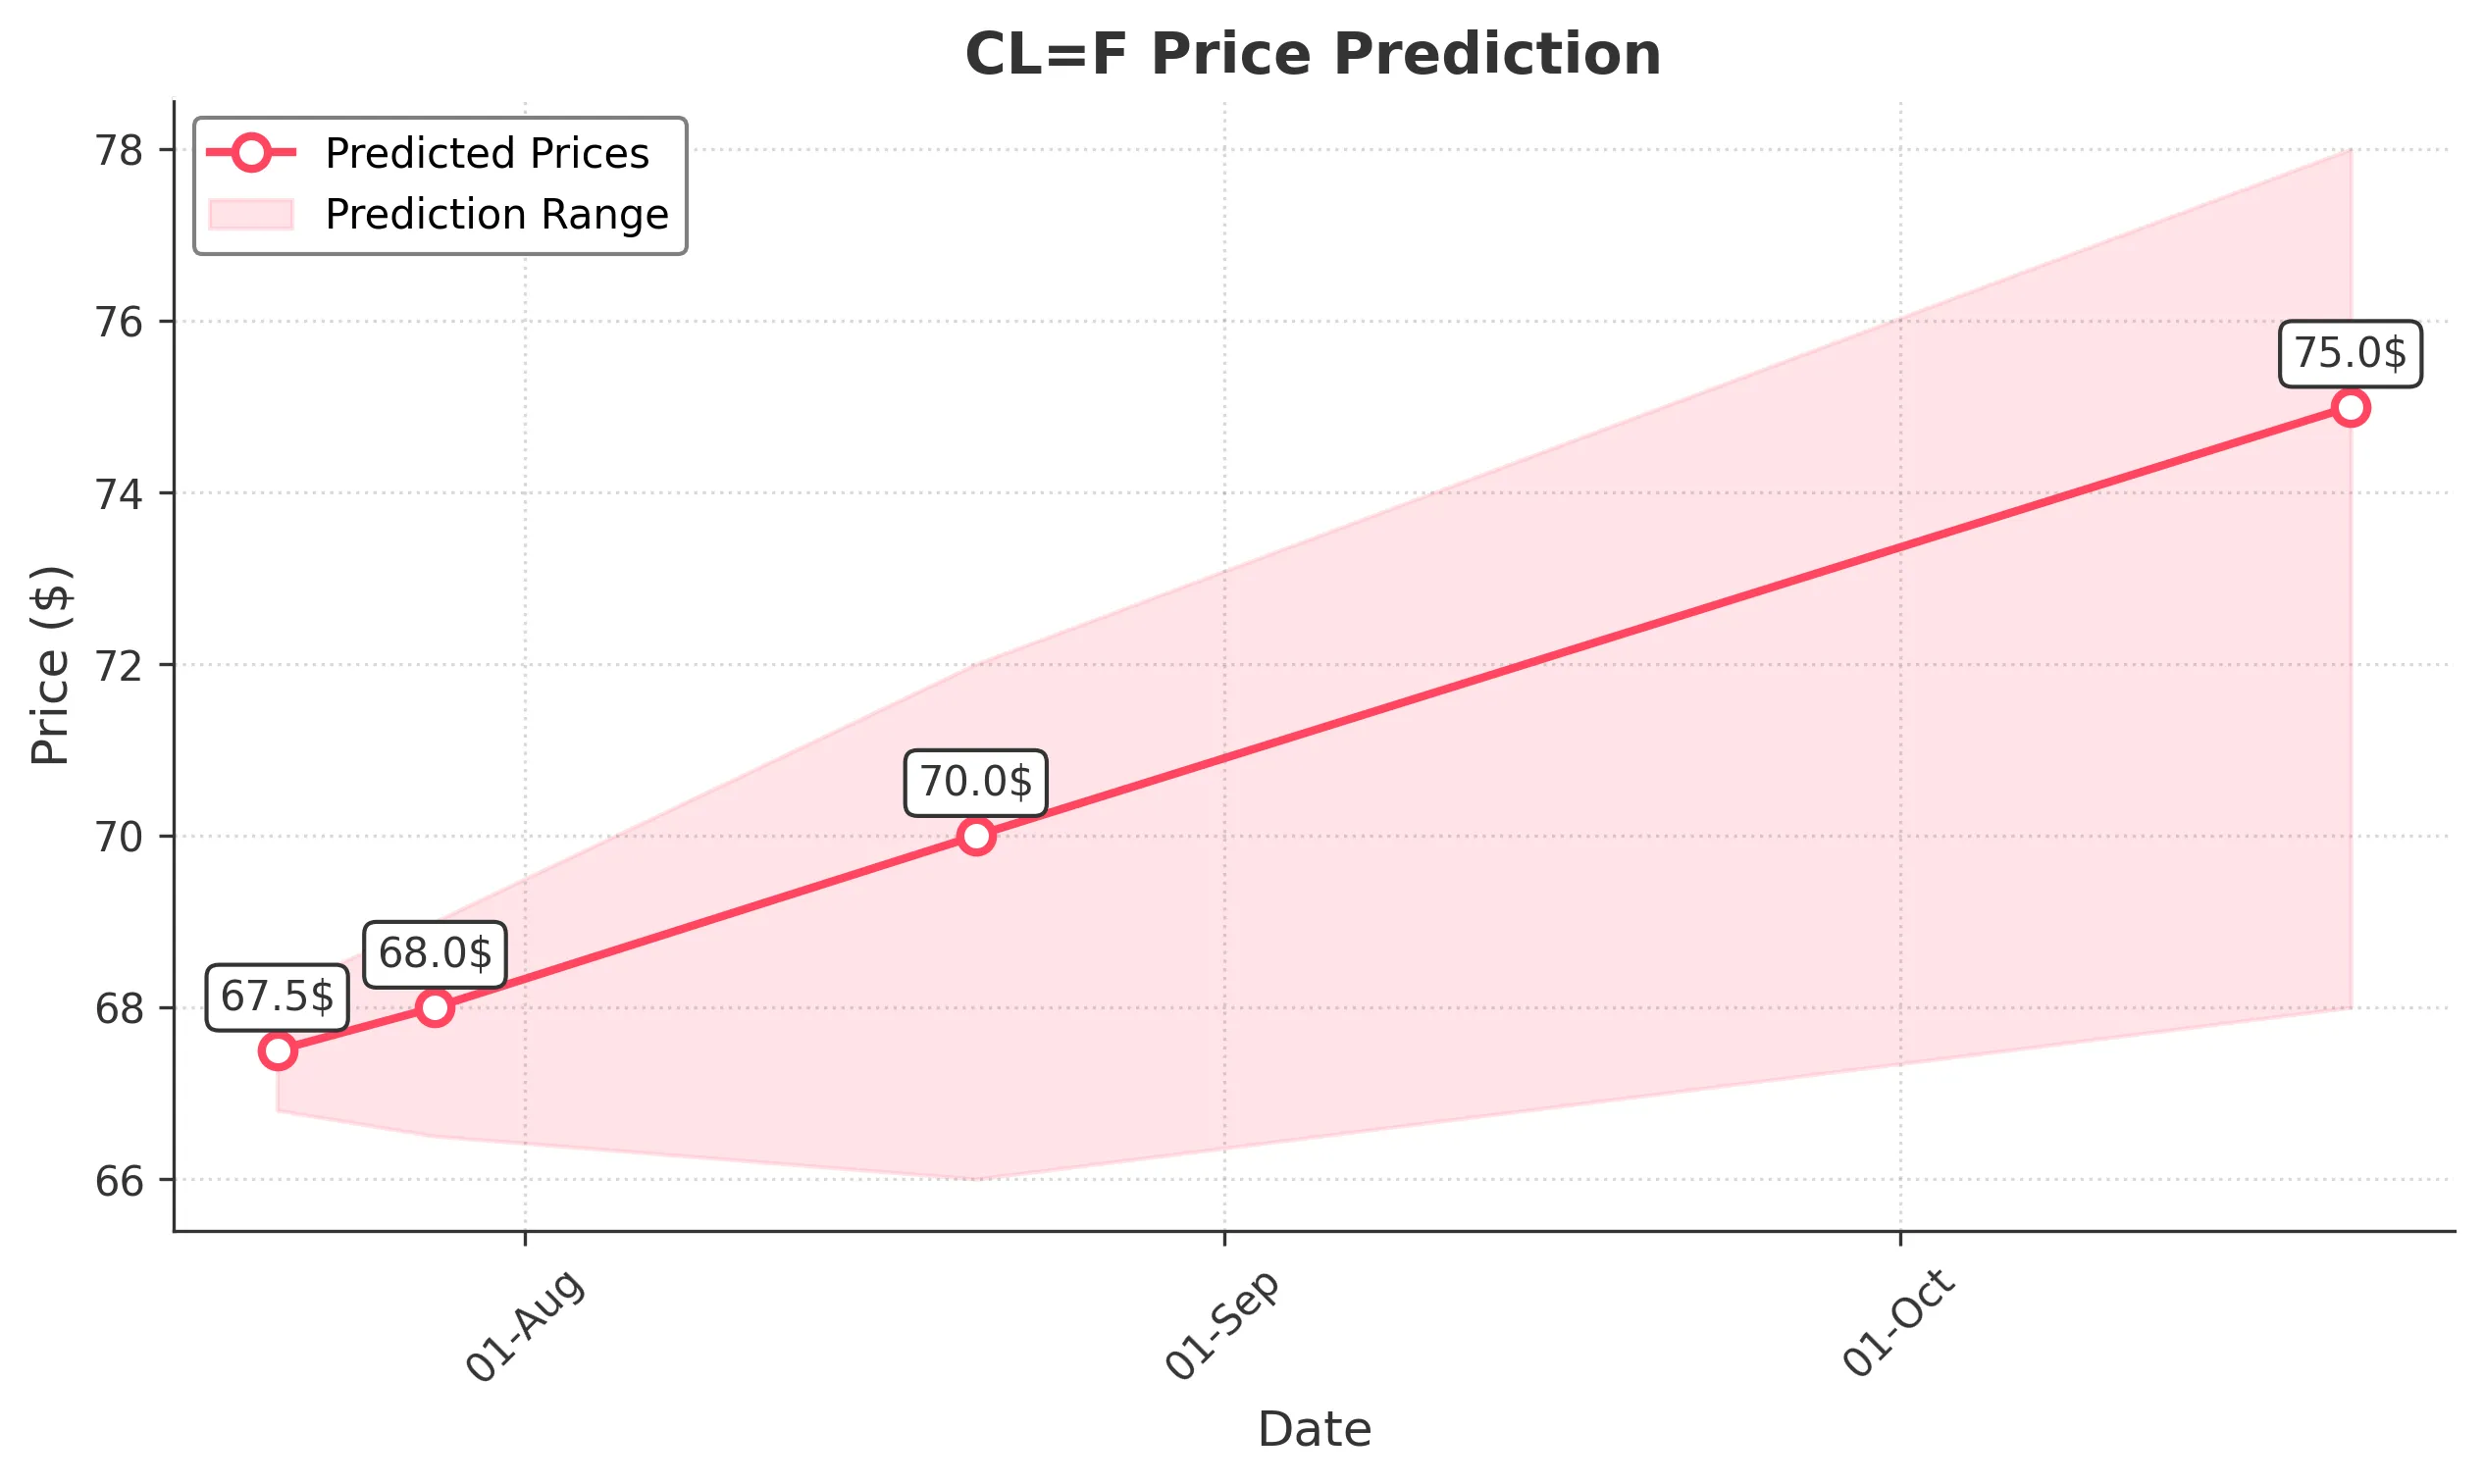
Target: July 21, 2025$67.5
$67.4
$68.2
$66.8
Description
The stock shows a slight bullish trend with a recent upward movement. The RSI is near 60, indicating strength, while MACD is positive. However, recent volatility suggests caution. Expect a close around 67.50.
Analysis
Over the past 3 months, CL=F has shown a bullish trend with significant resistance at 68.00. Recent volume spikes indicate strong interest, but the stock is approaching overbought territory. Key support is at 66.00.
Confidence Level
Potential Risks
Potential reversal due to overbought conditions and market sentiment could shift quickly.
1 Week Prediction
Target: July 28, 2025$68
$67.8
$69
$66.5
Description
The stock is expected to maintain its upward momentum, supported by positive market sentiment and strong volume. However, resistance at 68.50 may limit gains. A close around 68.00 is likely.
Analysis
CL=F has been trending upward, with key resistance at 68.50. The MACD indicates bullish momentum, while the RSI suggests potential overbought conditions. Volume remains strong, indicating continued interest.
Confidence Level
Potential Risks
Market volatility and external economic factors could impact performance.
1 Month Prediction
Target: August 21, 2025$70
$69.5
$72
$66
Description
With continued bullish sentiment and potential breakout above 70.00, the stock is likely to reach 70.00. However, watch for resistance at 72.00. Volume trends support this upward movement.
Analysis
The stock has shown strong upward momentum, with significant support at 66.00. The MACD is bullish, and the RSI is approaching overbought levels. Volume patterns suggest sustained interest, but caution is warranted.
Confidence Level
Potential Risks
Market corrections or negative news could reverse the trend.
3 Months Prediction
Target: October 21, 2025$75
$74
$78
$68
Description
If the bullish trend continues, CL=F could reach 75.00, driven by strong market sentiment and potential breakout patterns. However, resistance at 78.00 may pose challenges.
Analysis
The stock has been on a bullish trajectory, with key resistance at 78.00. The MACD remains positive, but the RSI indicates potential overbought conditions. Volume trends suggest strong interest, but external factors could impact performance.
Confidence Level
Potential Risks
Long-term predictions are uncertain due to potential market shifts and economic factors.