OIL Trading Predictions
1 Day Prediction
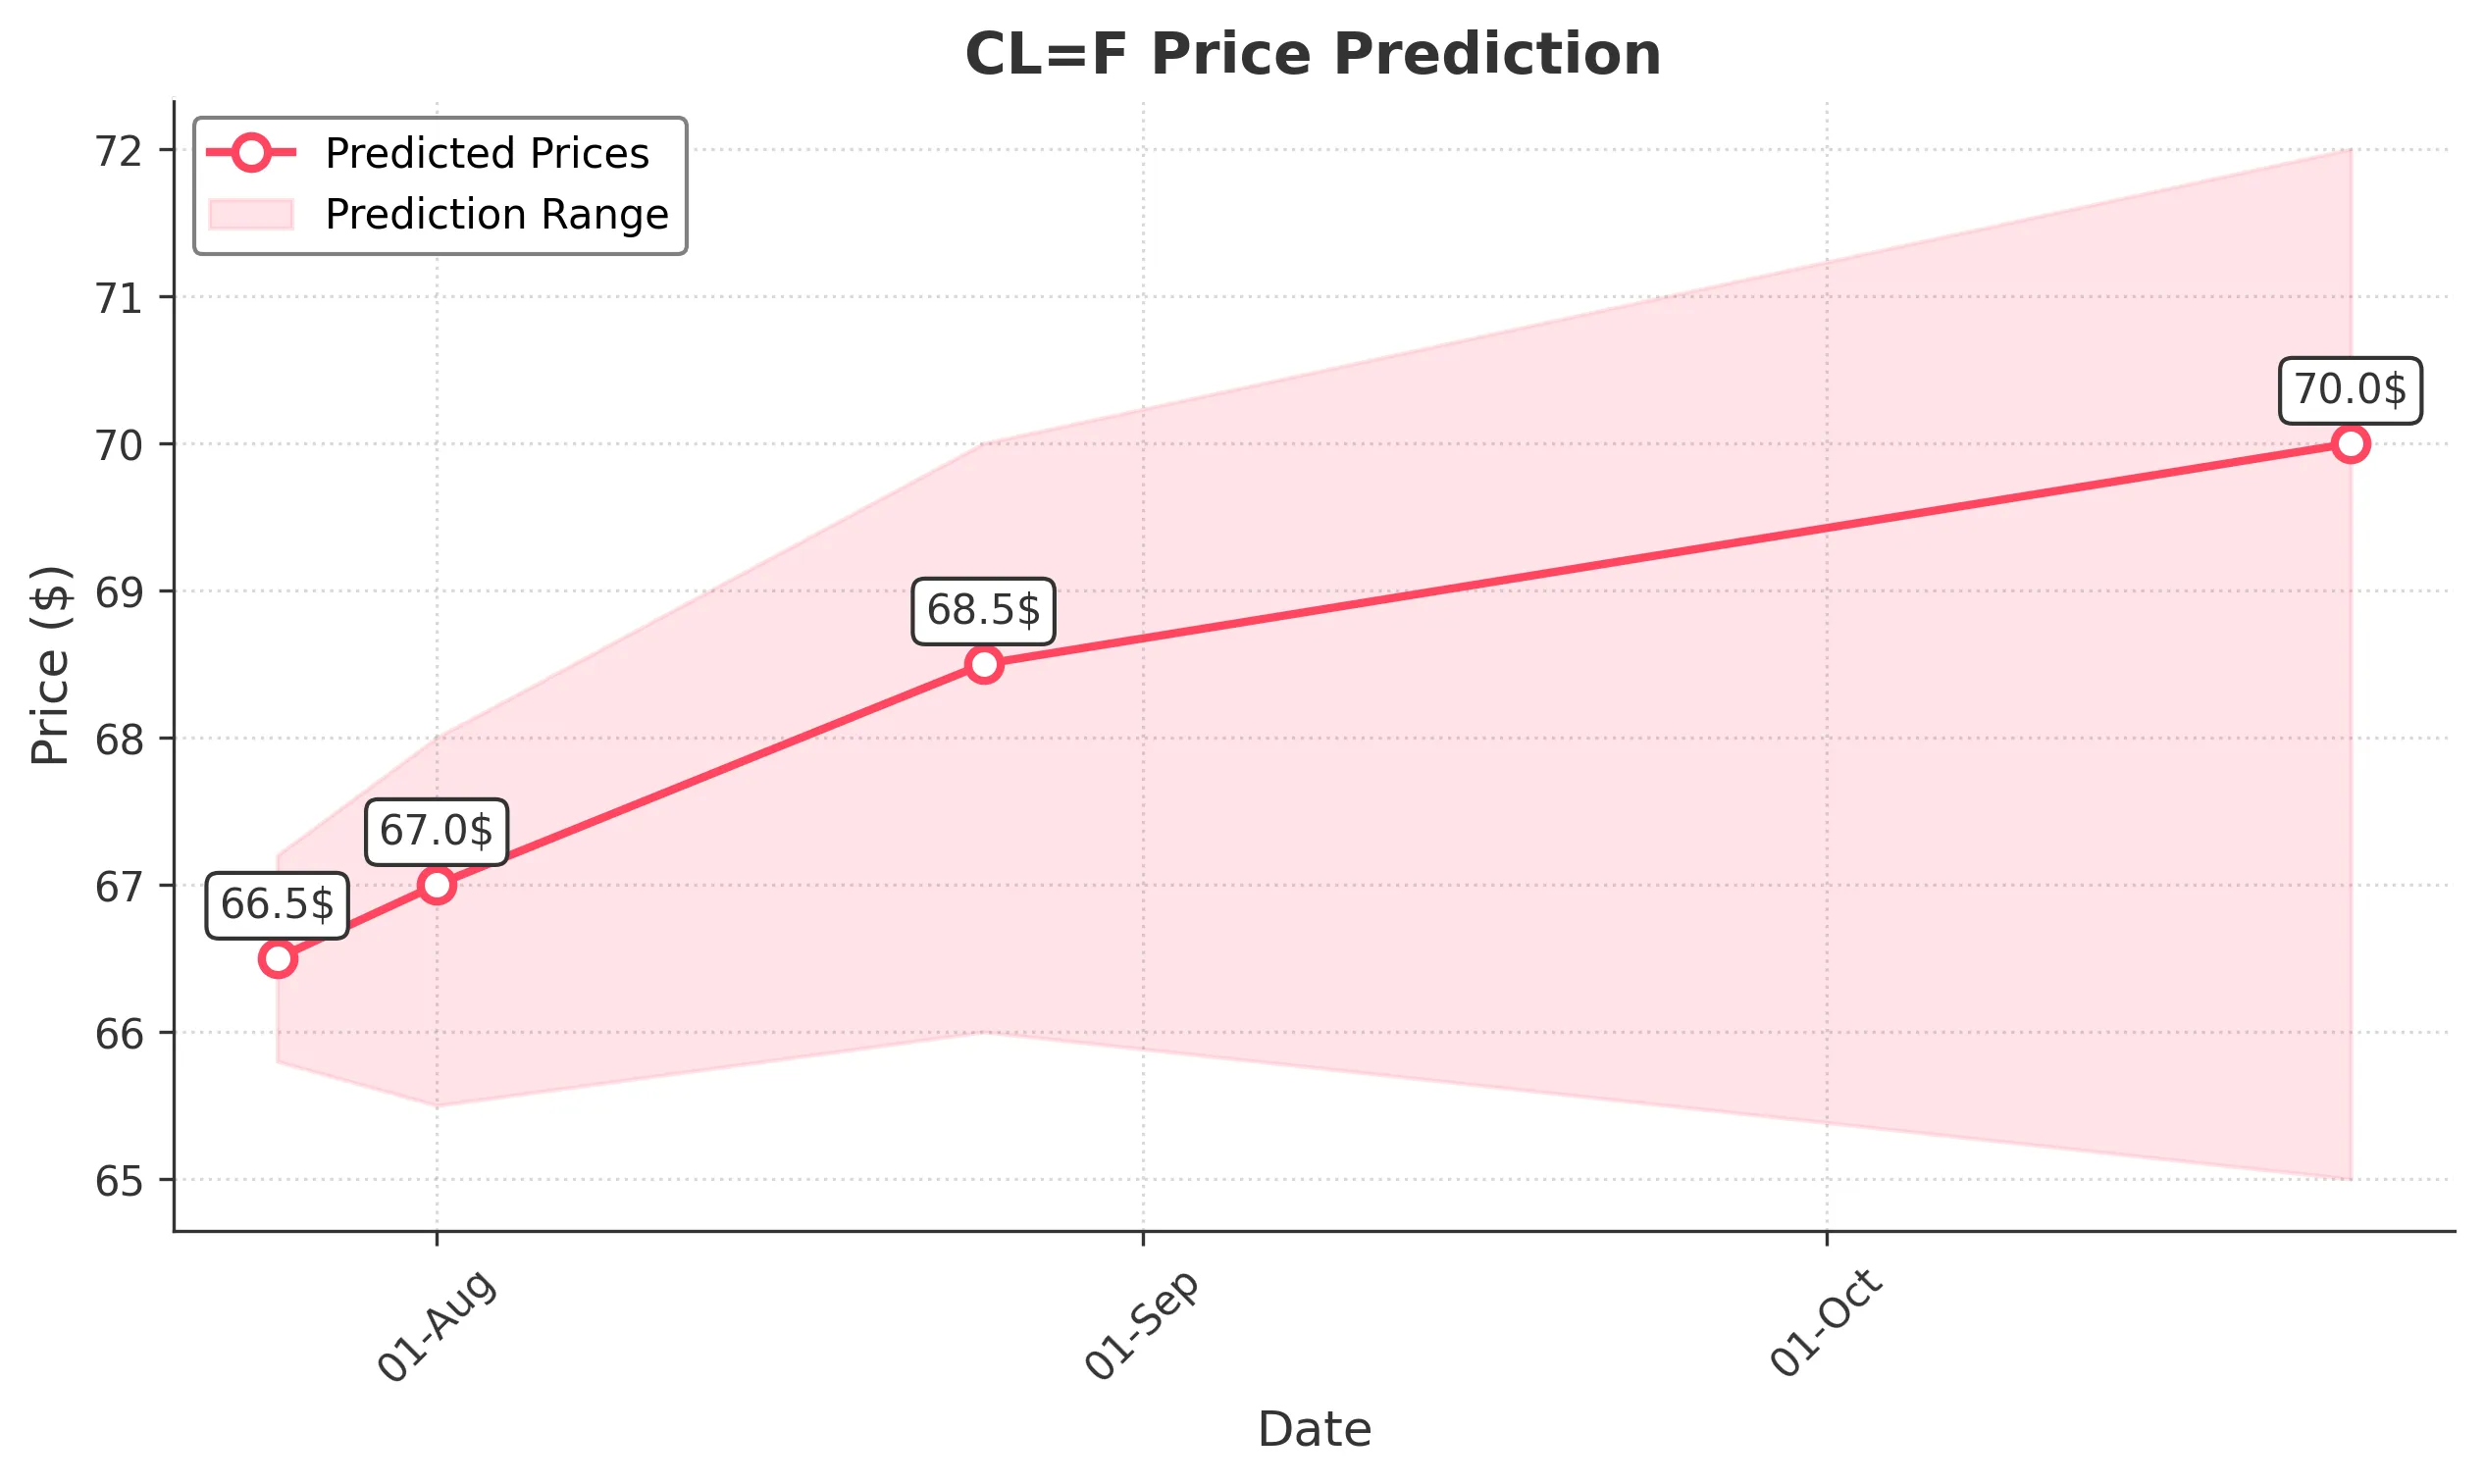
Target: July 25, 2025$66.5
$66.8
$67.2
$65.8
Description
The stock shows a slight bullish trend with a recent Doji candlestick indicating indecision. The RSI is near 50, suggesting a potential upward move. However, MACD is flattening, indicating possible resistance ahead.
Analysis
Over the past 3 months, CL=F has shown a bullish trend with significant resistance around 68.00. The recent price action indicates consolidation, with support at 65.00. Volume has been moderate, with spikes during key price movements. Technical indicators suggest potential upward momentum, but caution is warranted due to market sentiment.
Confidence Level
Potential Risks
Market volatility and external news could impact the price. A bearish reversal is possible if the price fails to break above recent highs.
1 Week Prediction
Target: August 1, 2025$67
$66.8
$68
$65.5
Description
The stock is expected to continue its upward trajectory, supported by a bullish MACD crossover. The RSI is approaching overbought territory, indicating potential for a pullback. Watch for volume spikes as confirmation.
Analysis
The stock has been in a bullish phase, with key support at 65.00 and resistance at 68.00. The recent price action shows higher highs and higher lows, indicating strength. However, the RSI nearing overbought levels suggests caution for potential pullbacks.
Confidence Level
Potential Risks
If market sentiment shifts negatively or if macroeconomic factors arise, the stock could face downward pressure.
1 Month Prediction
Target: August 25, 2025$68.5
$67.5
$70
$66
Description
The stock is likely to test the upper resistance levels around 70.00. The bullish trend is supported by strong volume and positive market sentiment. However, the RSI indicates potential overbought conditions.
Analysis
CL=F has shown a strong upward trend with significant resistance at 70.00. The stock's performance has been characterized by increasing volume and bullish candlestick patterns. However, the potential for a pullback exists as the RSI approaches overbought levels.
Confidence Level
Potential Risks
A reversal could occur if the stock fails to maintain momentum or if external economic factors negatively impact the market.
3 Months Prediction
Target: October 24, 2025$70
$68
$72
$65
Description
The stock is expected to reach 70.00, driven by bullish momentum and positive market sentiment. However, the potential for a correction exists if the market experiences volatility.
Analysis
Over the past three months, CL=F has demonstrated a bullish trend with key support at 65.00 and resistance at 70.00. The stock's performance has been strong, but caution is advised as external factors could impact future price movements.
Confidence Level
Potential Risks
Unforeseen macroeconomic events or shifts in market sentiment could lead to significant price fluctuations.