OIL Trading Predictions
1 Day Prediction
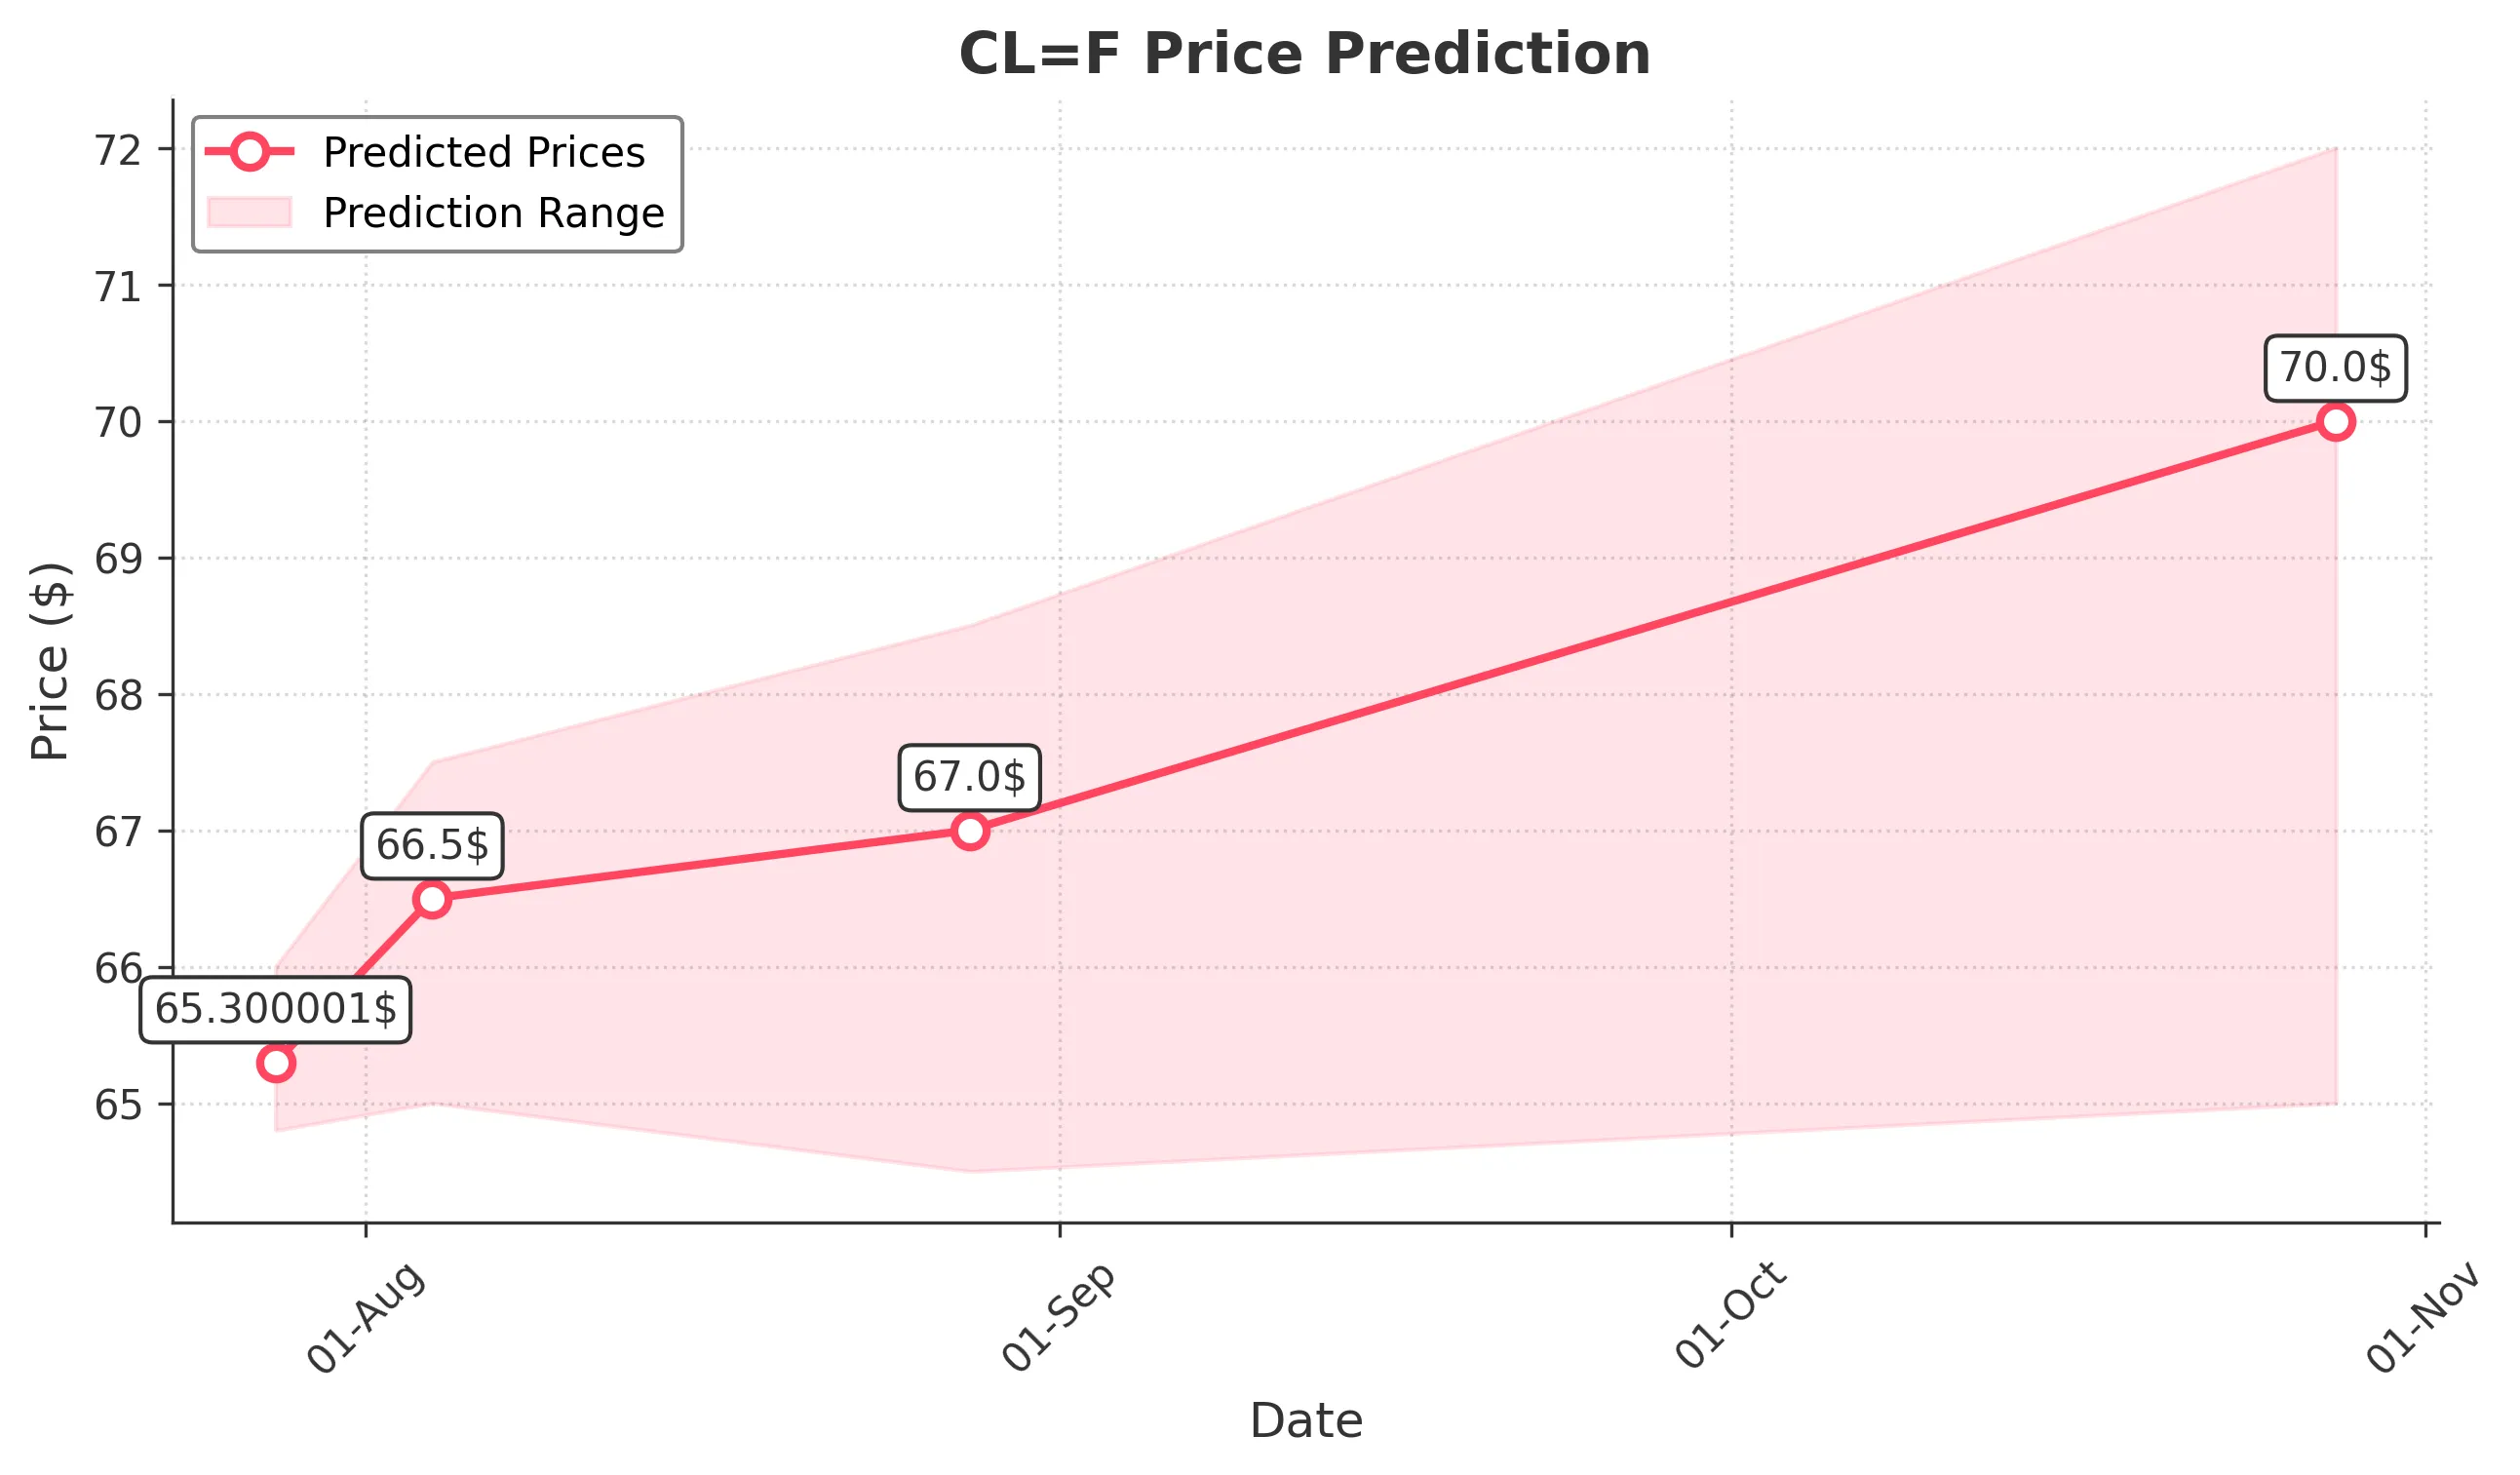
Target: July 28, 2025$65.300001
$65.160004
$66
$64.800003
Description
The stock shows a slight bullish trend with a potential close around 65.30. The RSI is neutral, and MACD indicates a potential upward momentum. However, recent volatility suggests caution.
Analysis
Over the past 3 months, CL=F has shown a bullish trend with significant resistance around 68.00. Recent candlestick patterns indicate indecision, and volume has been decreasing, suggesting potential consolidation.
Confidence Level
Potential Risks
Market sentiment could shift due to external news or earnings reports, impacting the prediction.
1 Week Prediction
Target: August 4, 2025$66.5
$65.300001
$67.5
$65
Description
Expect a close around 66.50 as the stock may find support at 65.00. The MACD is showing bullish divergence, but the RSI is nearing overbought territory, indicating potential pullbacks.
Analysis
The stock has been fluctuating between 65.00 and 68.00, with key support at 65.00. The ATR indicates increasing volatility, and recent volume spikes suggest traders are positioning for a breakout.
Confidence Level
Potential Risks
Potential market corrections or geopolitical events could lead to unexpected price movements.
1 Month Prediction
Target: August 28, 2025$67
$66.5
$68.5
$64.5
Description
A close around 67.00 is anticipated as the stock may test resistance at 68.50. The bullish trend is supported by moving averages, but caution is advised due to potential overbought conditions.
Analysis
CL=F has shown a bullish trend with resistance at 68.50. The RSI is approaching overbought levels, and the MACD indicates potential exhaustion. Volume patterns suggest traders are cautious.
Confidence Level
Potential Risks
Economic data releases or changes in oil prices could significantly impact the stock's performance.
3 Months Prediction
Target: October 28, 2025$70
$67
$72
$65
Description
Expect a close around 70.00 as the stock may break through resistance levels. The bullish trend is supported by strong fundamentals, but external factors could introduce volatility.
Analysis
The stock has been on a bullish trajectory, with key resistance at 72.00. The MACD shows bullish momentum, but the RSI indicates potential overbought conditions. Volume has been inconsistent, suggesting uncertainty.
Confidence Level
Potential Risks
Unforeseen geopolitical events or economic downturns could lead to significant price corrections.