OIL Trading Predictions
1 Day Prediction
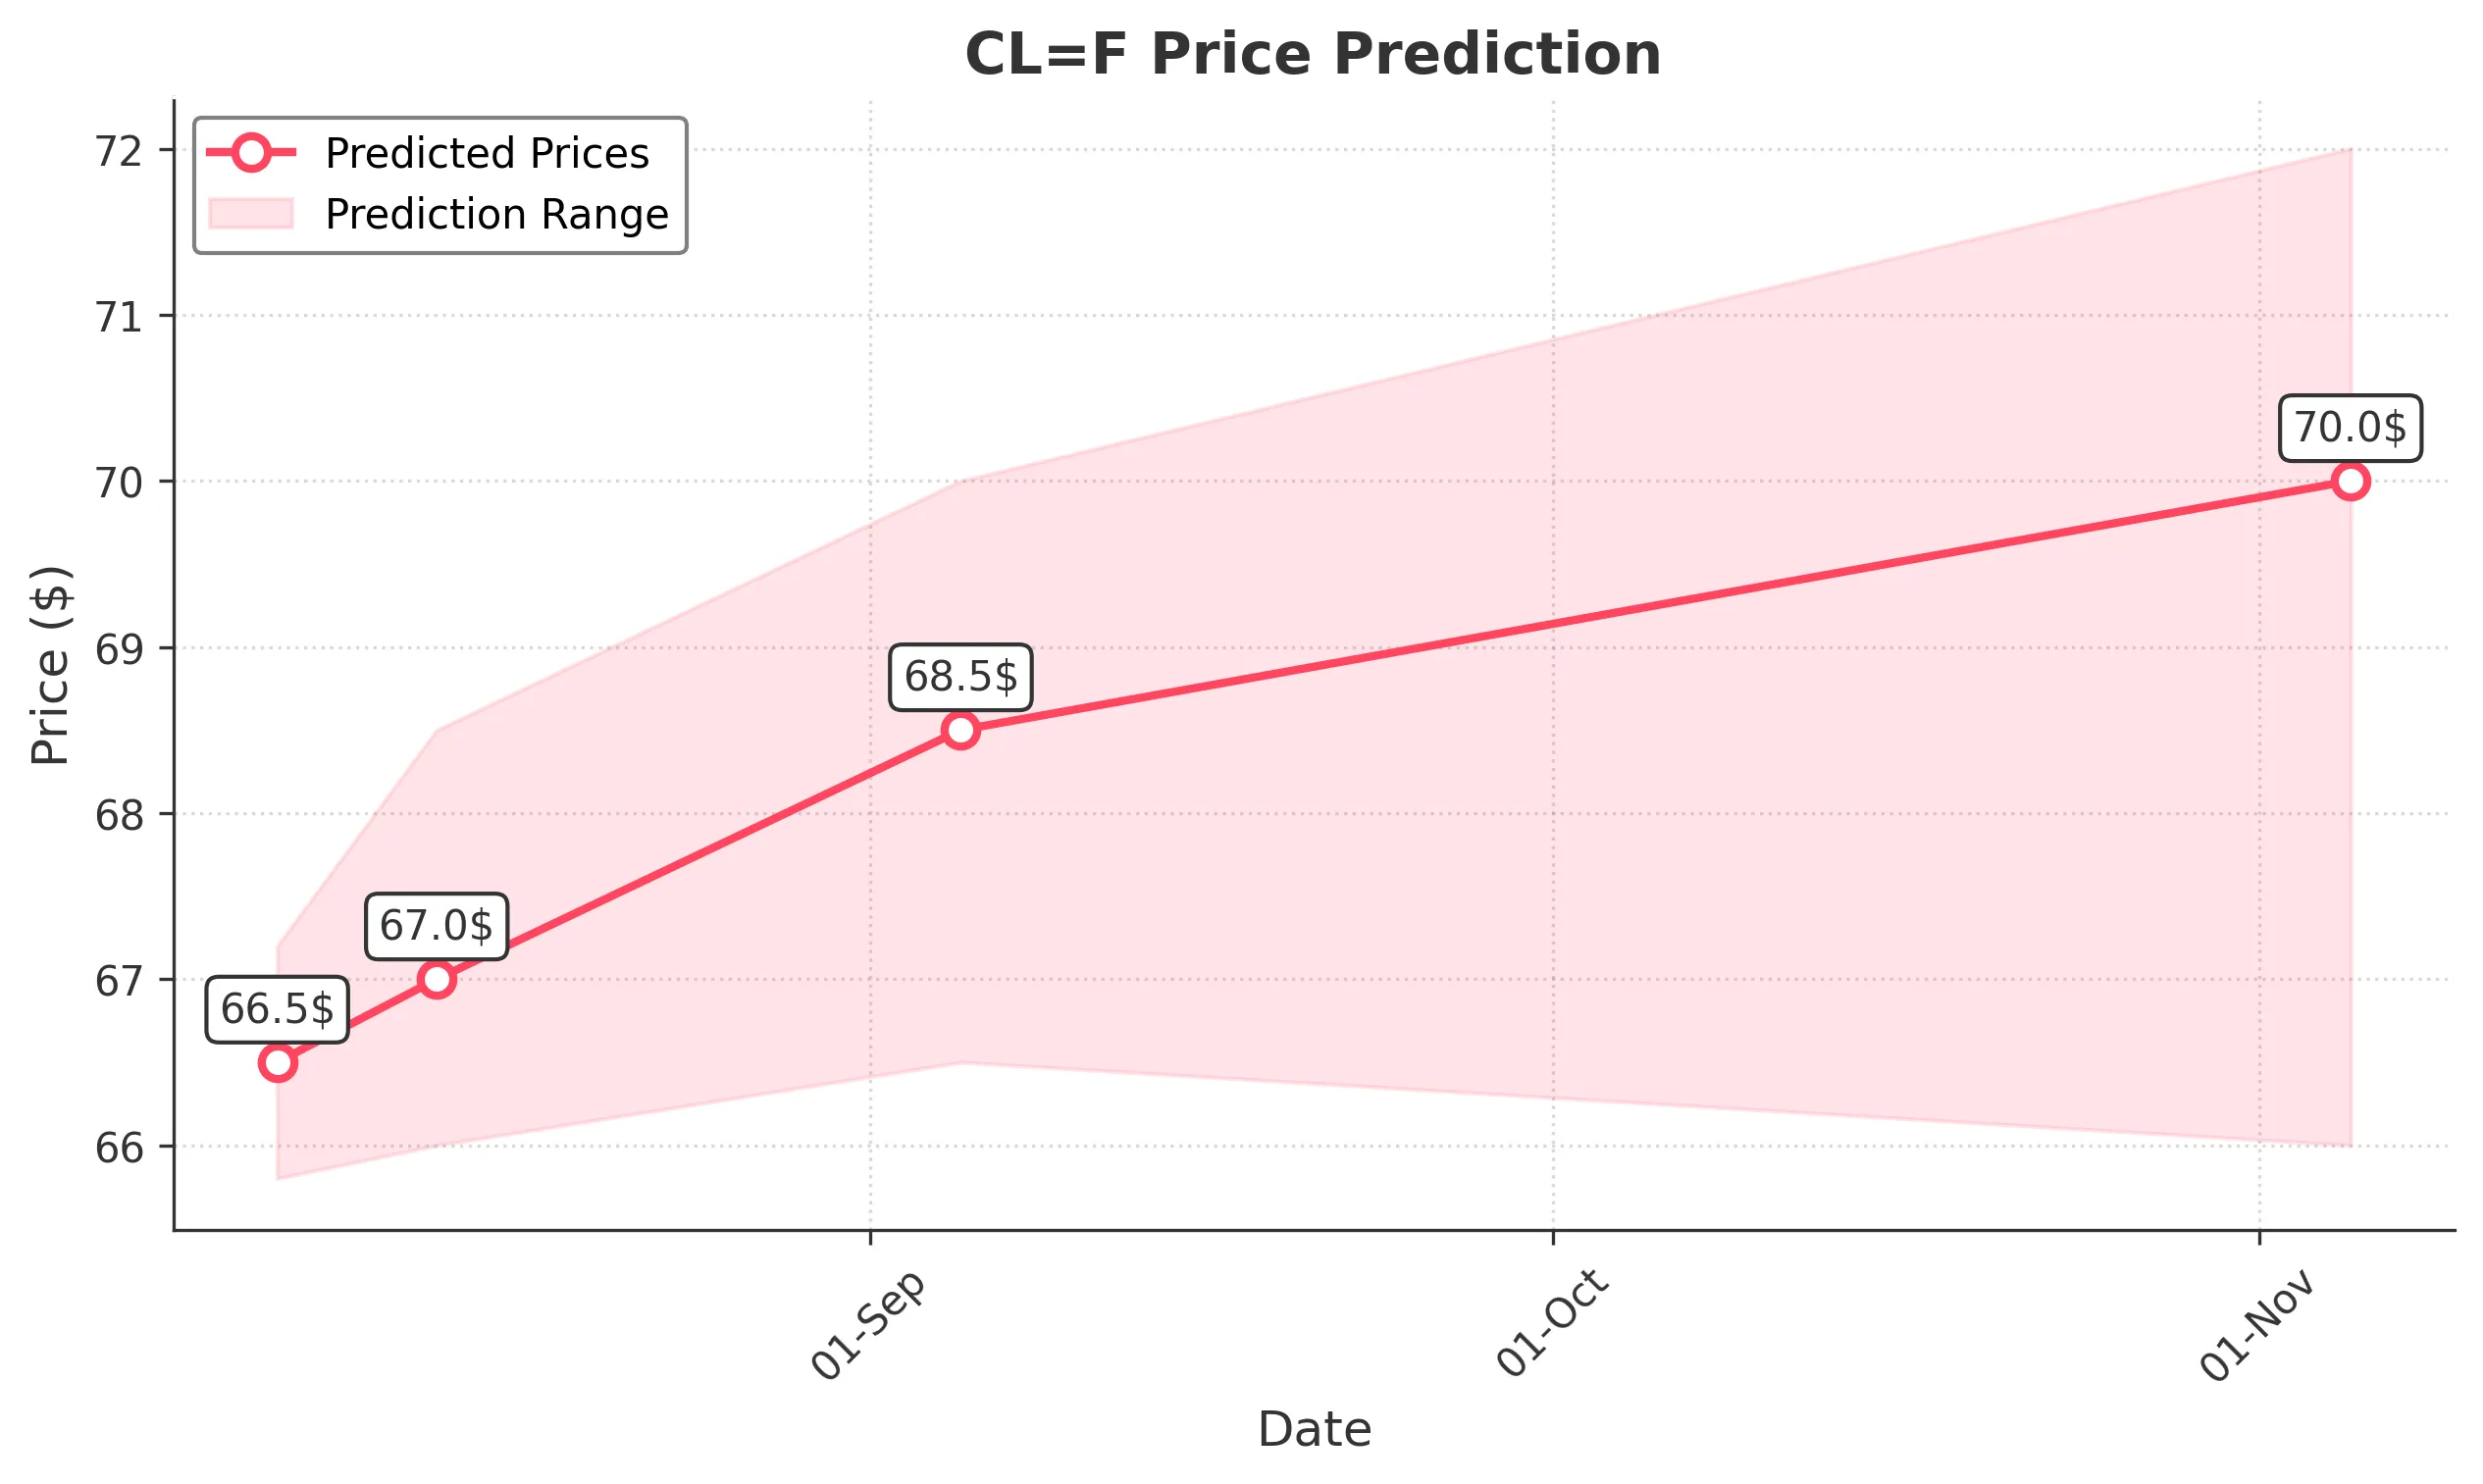
Target: August 6, 2025$66.5
$66.3
$67.2
$65.8
Description
The stock shows a slight bullish trend with a recent Doji candlestick indicating indecision. RSI is neutral, and MACD is close to crossing above the signal line, suggesting potential upward momentum. However, recent volume is low, indicating caution.
Analysis
Over the past 3 months, CL=F has shown a bullish trend with significant upward movements, particularly in early June. Key resistance is around $72, while support is at $65. Technical indicators suggest potential for further gains, but market sentiment remains mixed.
Confidence Level
Potential Risks
Low volume could lead to volatility; external market factors may also impact price.
1 Week Prediction
Target: August 13, 2025$67
$66.8
$68.5
$66
Description
The stock is expected to maintain a bullish trend with potential for slight gains. The MACD indicates upward momentum, while the RSI is approaching overbought territory. A potential pullback could occur if volume does not increase.
Analysis
The stock has been trending upward, with recent highs around $70. Key support at $65 remains intact. Technical indicators show bullish signals, but caution is warranted as the stock approaches overbought conditions.
Confidence Level
Potential Risks
Market volatility and external economic factors could lead to unexpected price movements.
1 Month Prediction
Target: September 5, 2025$68.5
$67.5
$70
$66.5
Description
The stock is likely to continue its upward trajectory, supported by bullish technical indicators. The recent breakout above $68 suggests further gains, but the RSI indicates potential overbought conditions, warranting caution.
Analysis
CL=F has shown strong performance with significant upward movements. Key resistance levels are at $70, while support is at $66. The stock's bullish trend is supported by positive technical indicators, but caution is advised as it approaches overbought levels.
Confidence Level
Potential Risks
Potential market corrections and economic news could impact the stock's performance.
3 Months Prediction
Target: November 5, 2025$70
$68
$72
$66
Description
The stock is expected to reach new highs, driven by strong demand and bullish sentiment. However, the RSI indicates potential overbought conditions, suggesting a possible correction. Monitoring volume trends will be crucial.
Analysis
Over the past three months, CL=F has shown a strong bullish trend, with significant price increases. Key resistance is at $72, while support is at $66. Technical indicators suggest continued upward momentum, but caution is warranted as the stock approaches overbought territory.
Confidence Level
Potential Risks
Market volatility and economic conditions could lead to unexpected price fluctuations.