OIL Trading Predictions
1 Day Prediction
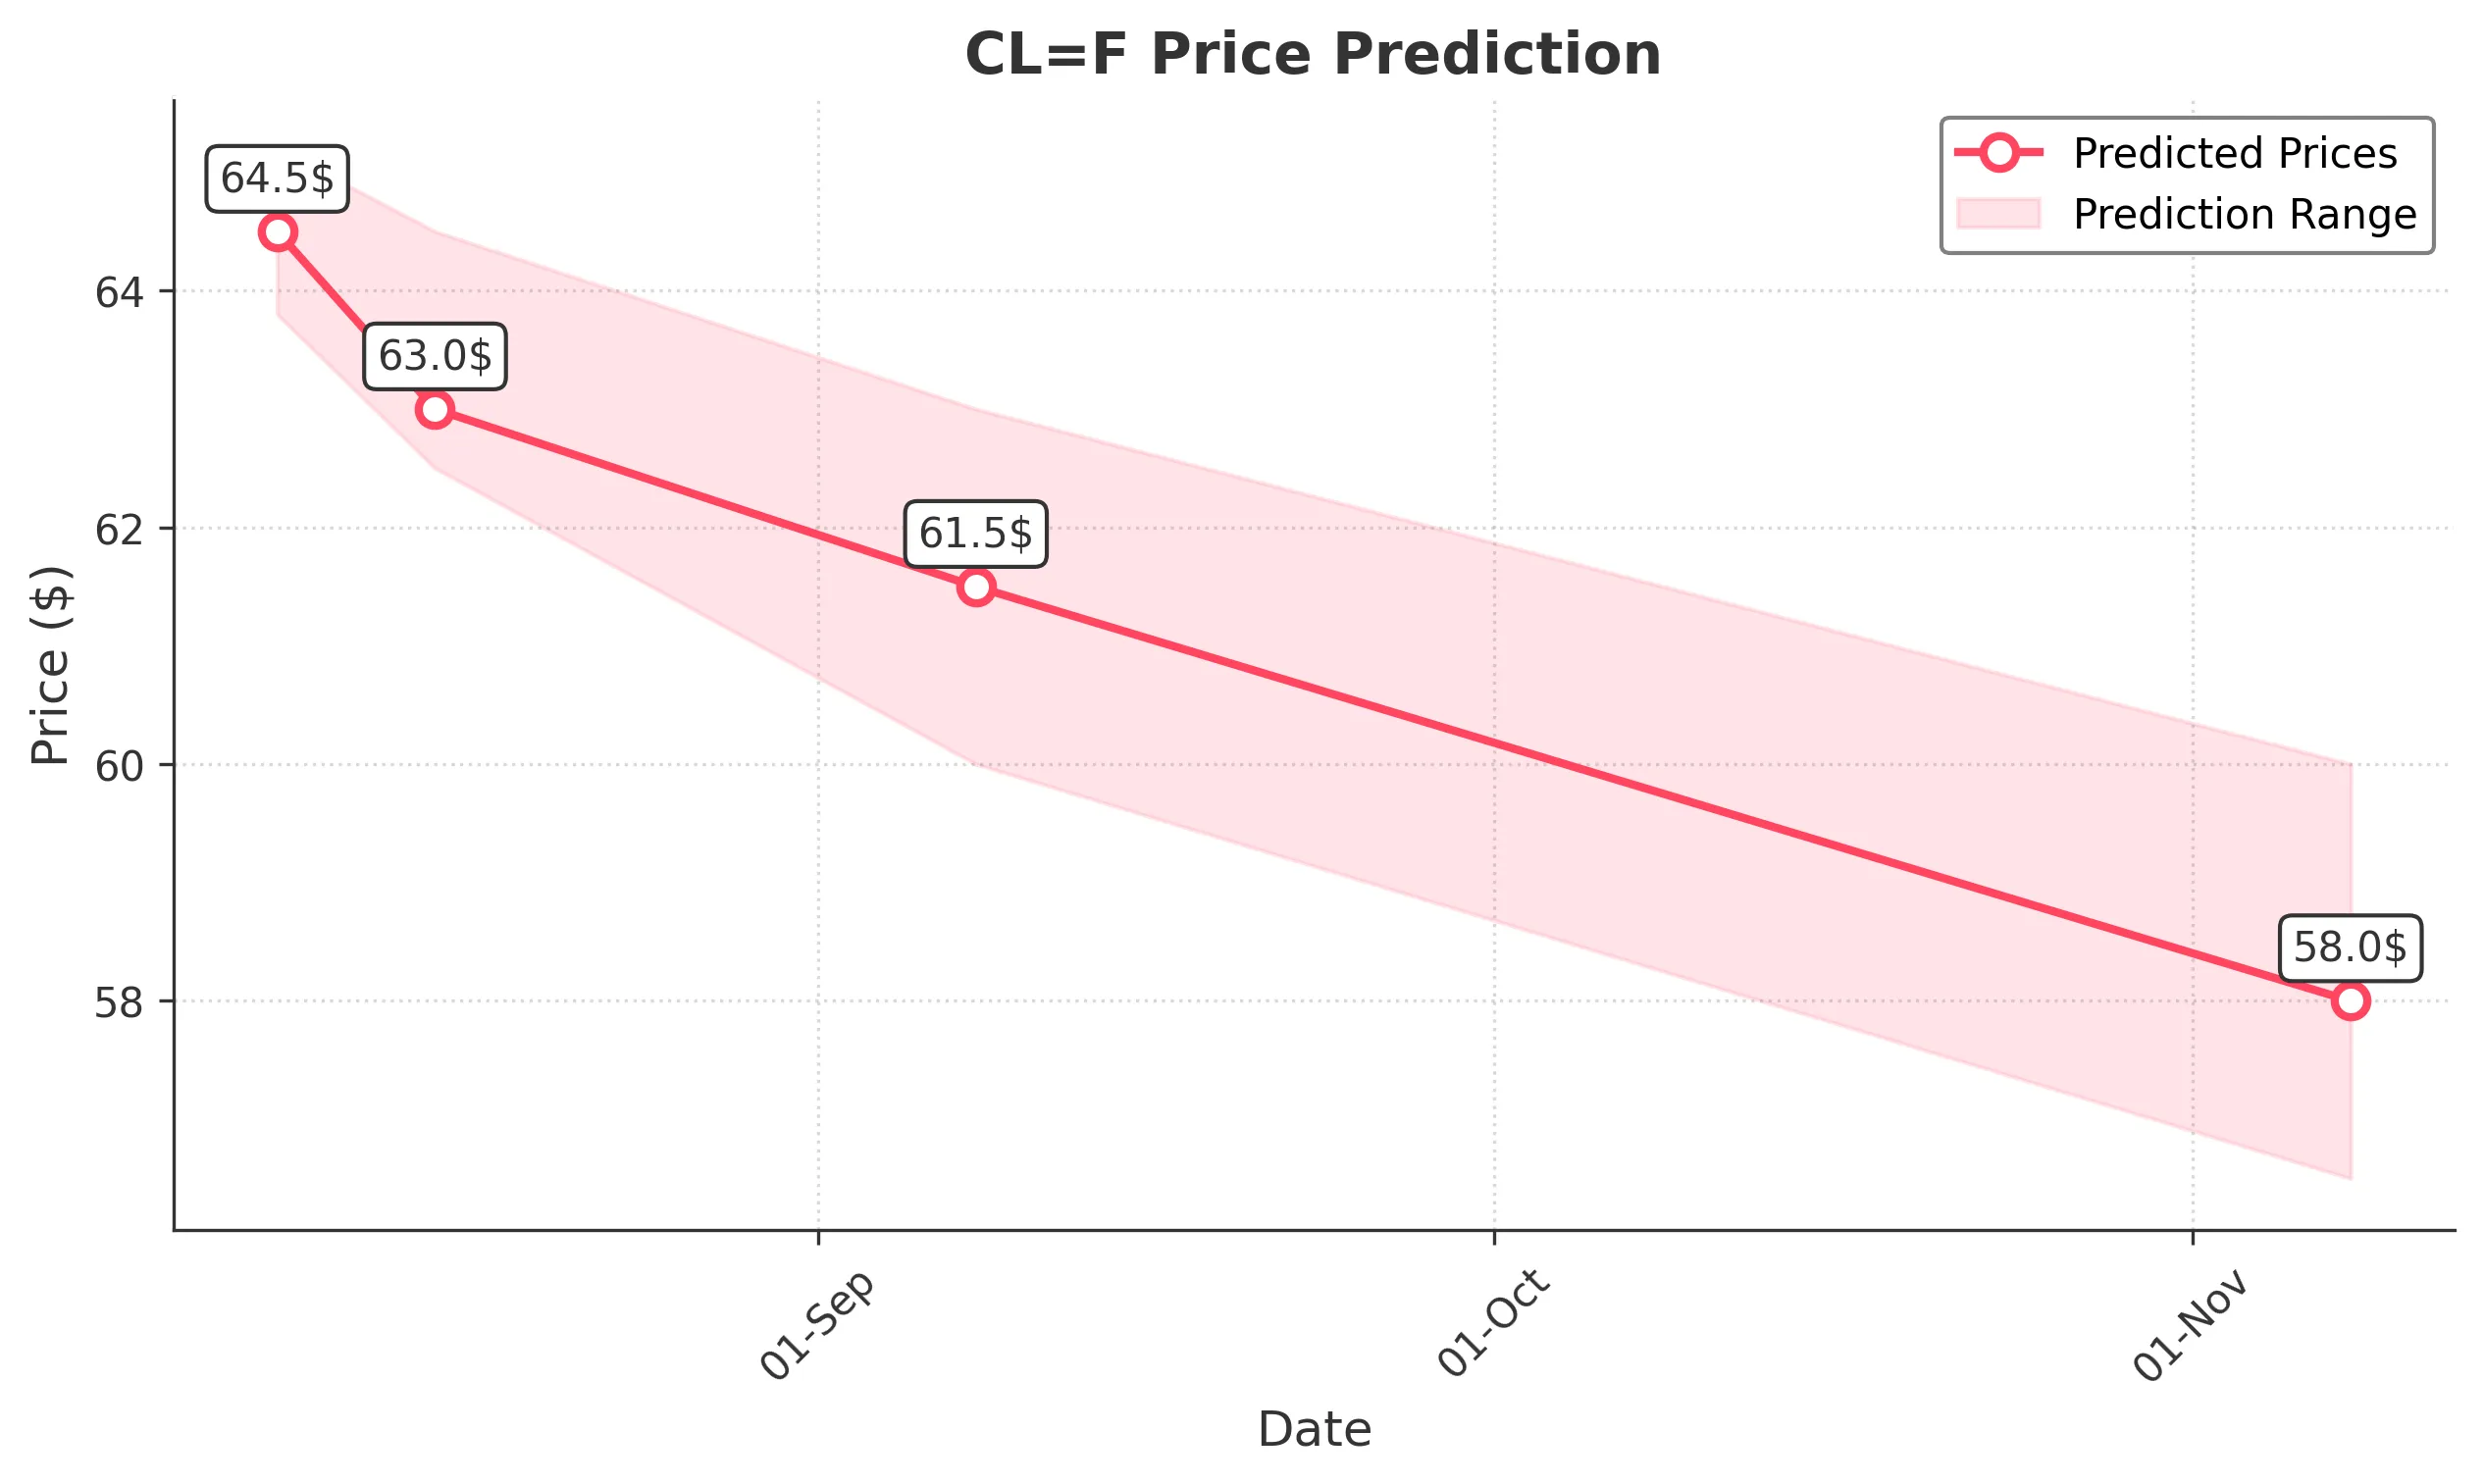
Target: August 8, 2025$64.5
$64.8
$65.2
$63.8
Description
The stock shows a bearish trend with a recent decline in price and volume. RSI indicates overbought conditions, suggesting a potential pullback. The recent candlestick patterns show indecision, indicating possible downward pressure.
Analysis
Over the past 3 months, CL=F has shown a bullish trend with significant highs, but recent price action indicates a potential reversal. Key support at $64.00 and resistance at $70.00. Volume has been inconsistent, with spikes during price increases. Technical indicators suggest caution.
Confidence Level
Potential Risks
Market volatility and external news could impact the prediction. A sudden bullish reversal is possible if market sentiment shifts.
1 Week Prediction
Target: August 15, 2025$63
$64
$64.5
$62.5
Description
The bearish trend is expected to continue as the stock faces resistance at $65.00. The MACD shows a bearish crossover, and the RSI is trending downwards, indicating weakening momentum. Volume may increase as traders react to price movements.
Analysis
The stock has been in a corrective phase after reaching recent highs. Key support levels are being tested, and the overall market sentiment appears cautious. Technical indicators suggest a potential continuation of the downward trend.
Confidence Level
Potential Risks
Unforeseen macroeconomic events or changes in market sentiment could lead to unexpected price movements.
1 Month Prediction
Target: September 8, 2025$61.5
$62
$63
$60
Description
The stock is likely to continue its bearish trend as it approaches key support levels. The Bollinger Bands indicate a squeeze, suggesting potential volatility. The overall market sentiment remains cautious, which may lead to further declines.
Analysis
CL=F has shown a significant pullback from recent highs. The stock is currently testing support levels, and technical indicators suggest a bearish outlook. Volume patterns indicate a lack of strong buying interest.
Confidence Level
Potential Risks
Market conditions can change rapidly, and any positive news could reverse the trend. Watch for volume spikes that may indicate a shift.
3 Months Prediction
Target: November 8, 2025$58
$59
$60
$56.5
Description
The stock may continue to decline as it approaches long-term support levels. The overall trend appears bearish, with potential for further downside if market conditions do not improve. Watch for any reversal patterns.
Analysis
Over the past three months, CL=F has experienced significant volatility. The stock is currently in a bearish phase, with key support levels being tested. Technical indicators suggest a cautious outlook, and external factors could influence future performance.
Confidence Level
Potential Risks
Long-term predictions are subject to greater uncertainty. Economic factors and market sentiment could significantly impact the stock's performance.