OIL Trading Predictions
1 Day Prediction
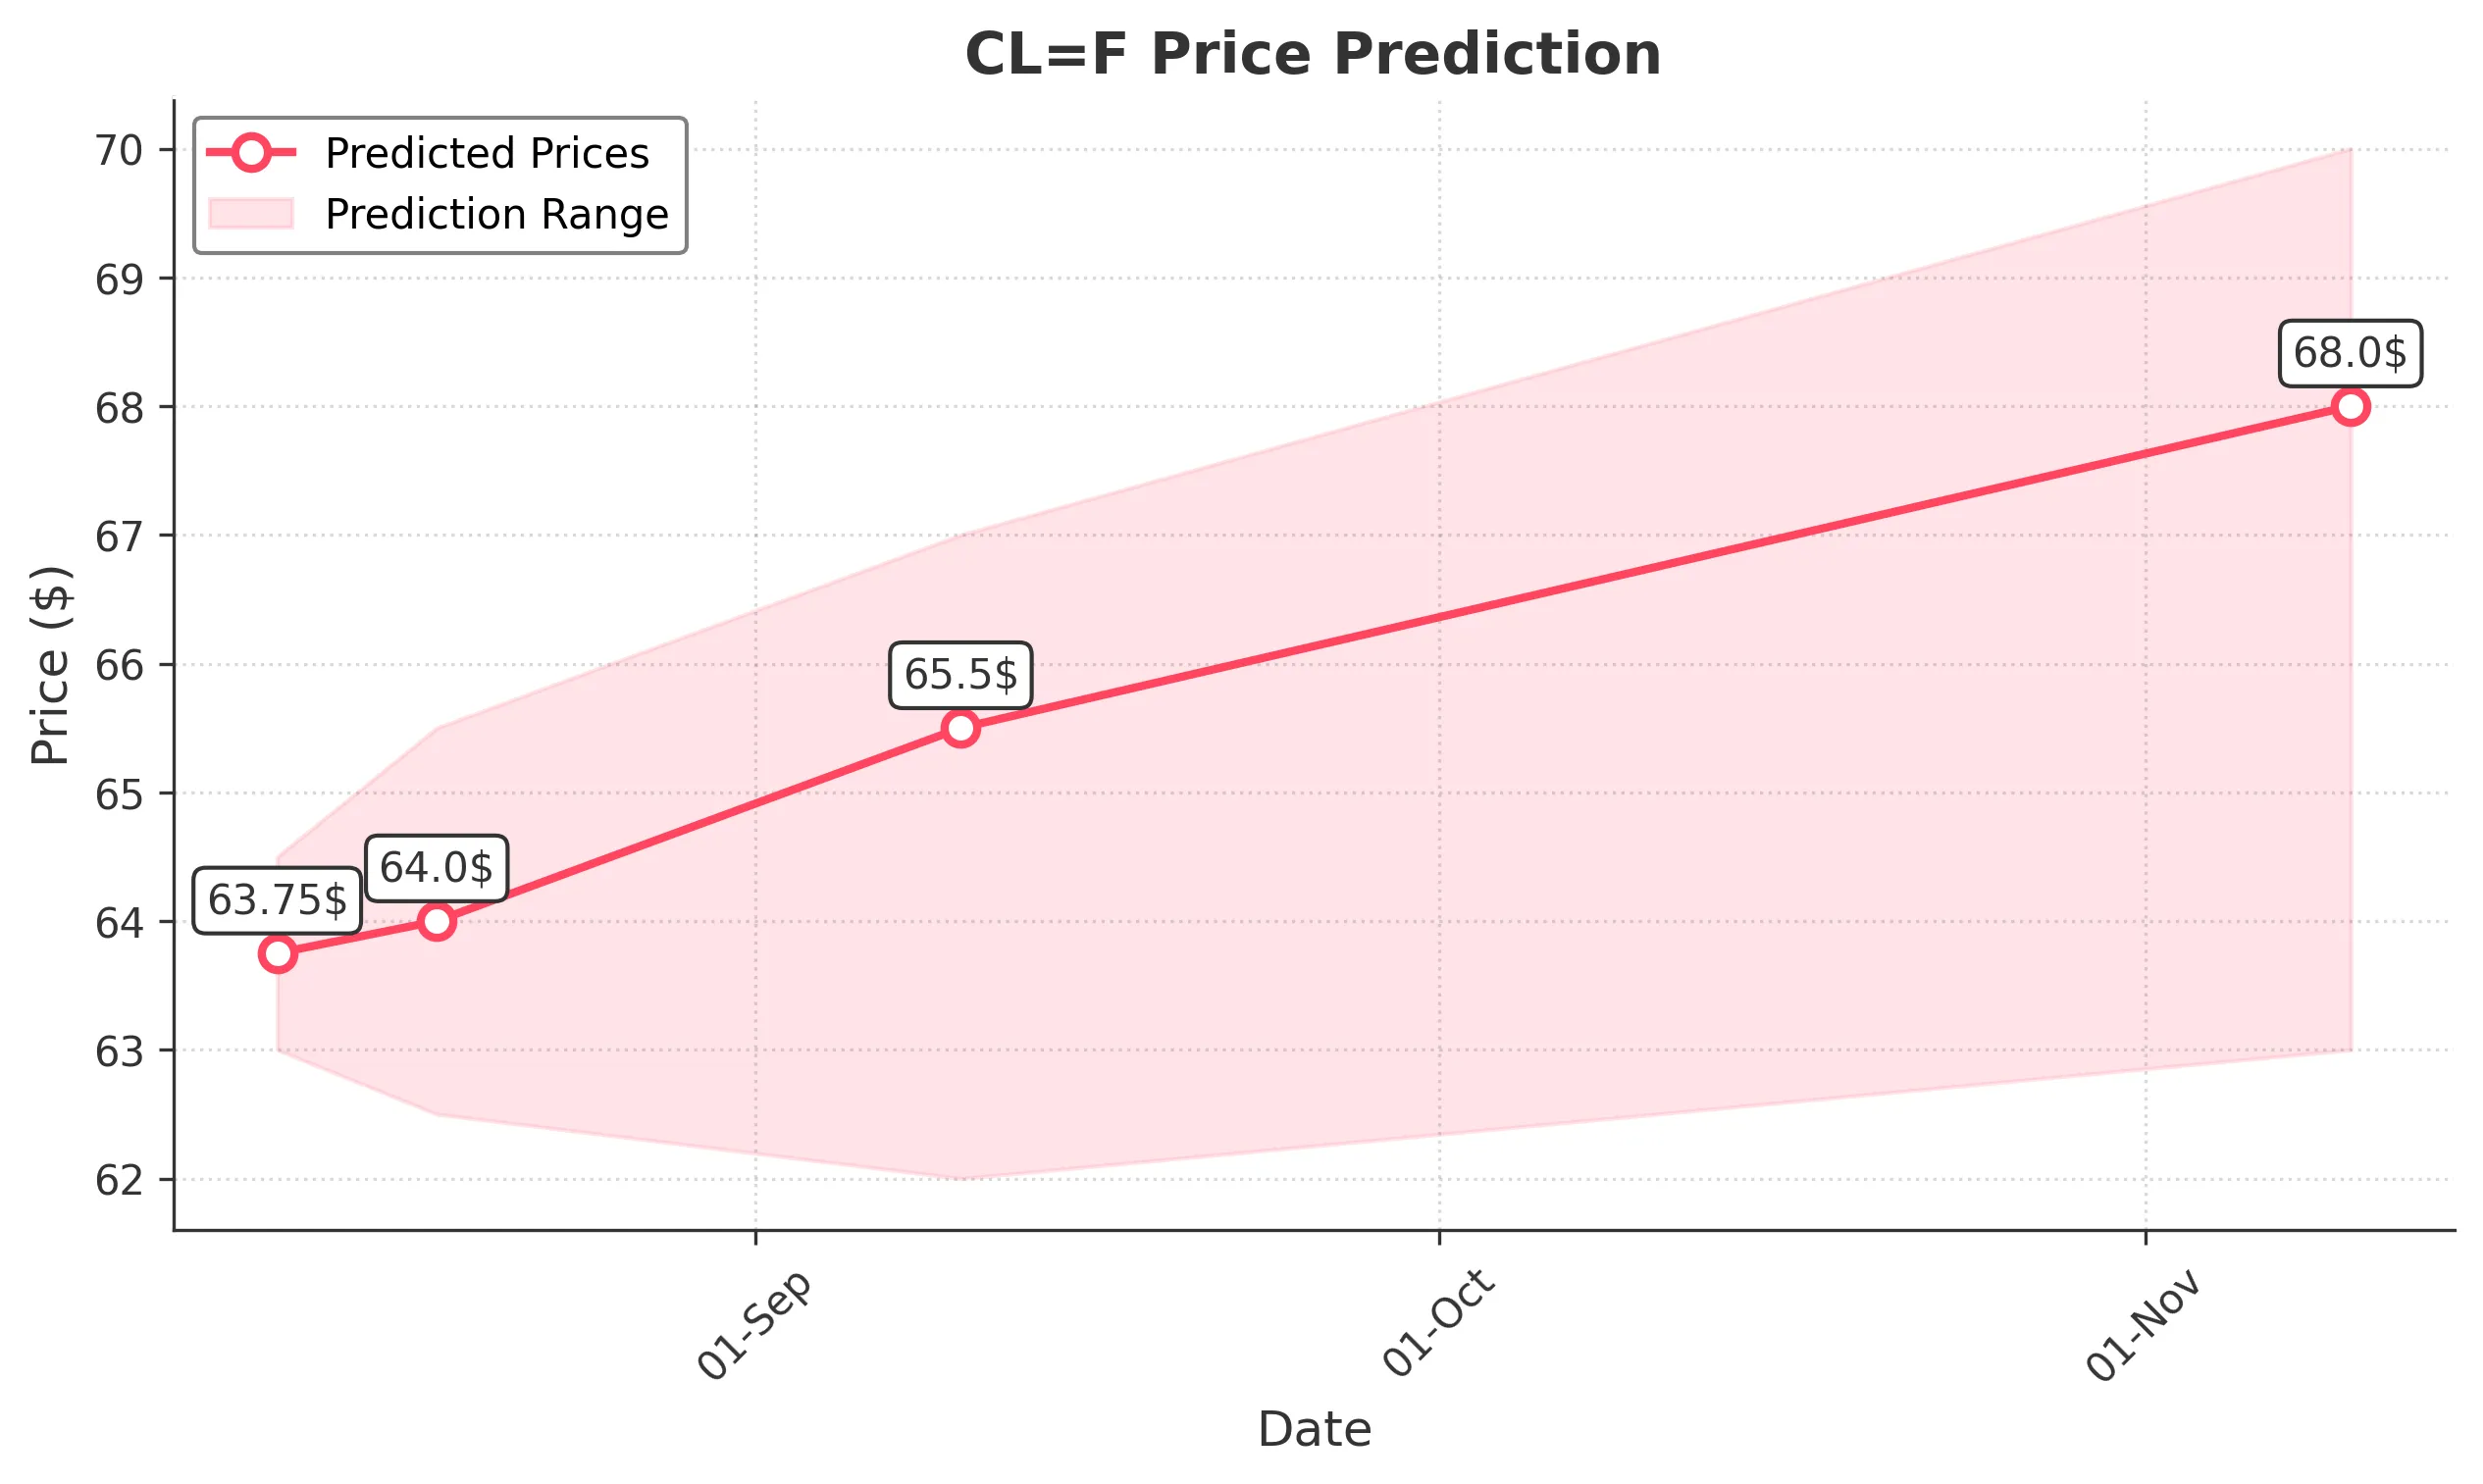
Target: August 11, 2025$63.75
$63.6
$64.5
$63
Description
The stock shows a slight bullish trend with a recent Doji candlestick indicating indecision. RSI is neutral, and MACD is close to crossing above the signal line, suggesting potential upward momentum. However, recent volume is lower, indicating caution.
Analysis
Over the past 3 months, CL=F has shown a bullish trend with significant resistance around $70. Recent price action indicates a pullback, with support at $63. Technical indicators like RSI and MACD suggest a potential reversal, but volatility remains a concern.
Confidence Level
Potential Risks
Market sentiment could shift quickly due to external news or economic data releases, which may impact the prediction.
1 Week Prediction
Target: August 18, 2025$64
$63.8
$65.5
$62.5
Description
The stock is expected to stabilize around $64, with potential upward movement as the MACD shows bullish divergence. However, the RSI indicates overbought conditions, which could lead to a pullback. Volume trends suggest cautious trading.
Analysis
The stock has been fluctuating around $63-$65, with resistance at $66. The recent price action shows a consolidation phase. Technical indicators are mixed, with some suggesting a bullish continuation while others indicate overbought conditions.
Confidence Level
Potential Risks
Potential market corrections or negative news could lead to a downward trend, impacting the accuracy of this prediction.
1 Month Prediction
Target: September 10, 2025$65.5
$64.5
$67
$62
Description
Expect a gradual increase towards $65.50 as bullish sentiment builds. The 50-day moving average is trending upwards, and the recent price action suggests a breakout above resistance. However, external factors could introduce volatility.
Analysis
The stock has shown resilience with a bullish trend over the past month. Key support at $62 and resistance at $66 are critical levels. Technical indicators suggest a potential upward breakout, but market sentiment remains cautious.
Confidence Level
Potential Risks
Economic indicators or geopolitical events could disrupt the expected trend, leading to unexpected price movements.
3 Months Prediction
Target: November 10, 2025$68
$66.5
$70
$63
Description
Long-term outlook remains bullish with potential to reach $68. The stock is likely to break through resistance levels as market sentiment improves. However, macroeconomic factors could introduce volatility.
Analysis
The stock has been on an upward trajectory, with key support at $63 and resistance at $70. Technical indicators suggest a bullish continuation, but external economic factors could impact performance. Overall, the outlook is cautiously optimistic.
Confidence Level
Potential Risks
Unforeseen economic downturns or changes in market sentiment could lead to a significant price drop, affecting the prediction.