OIL Trading Predictions
1 Day Prediction
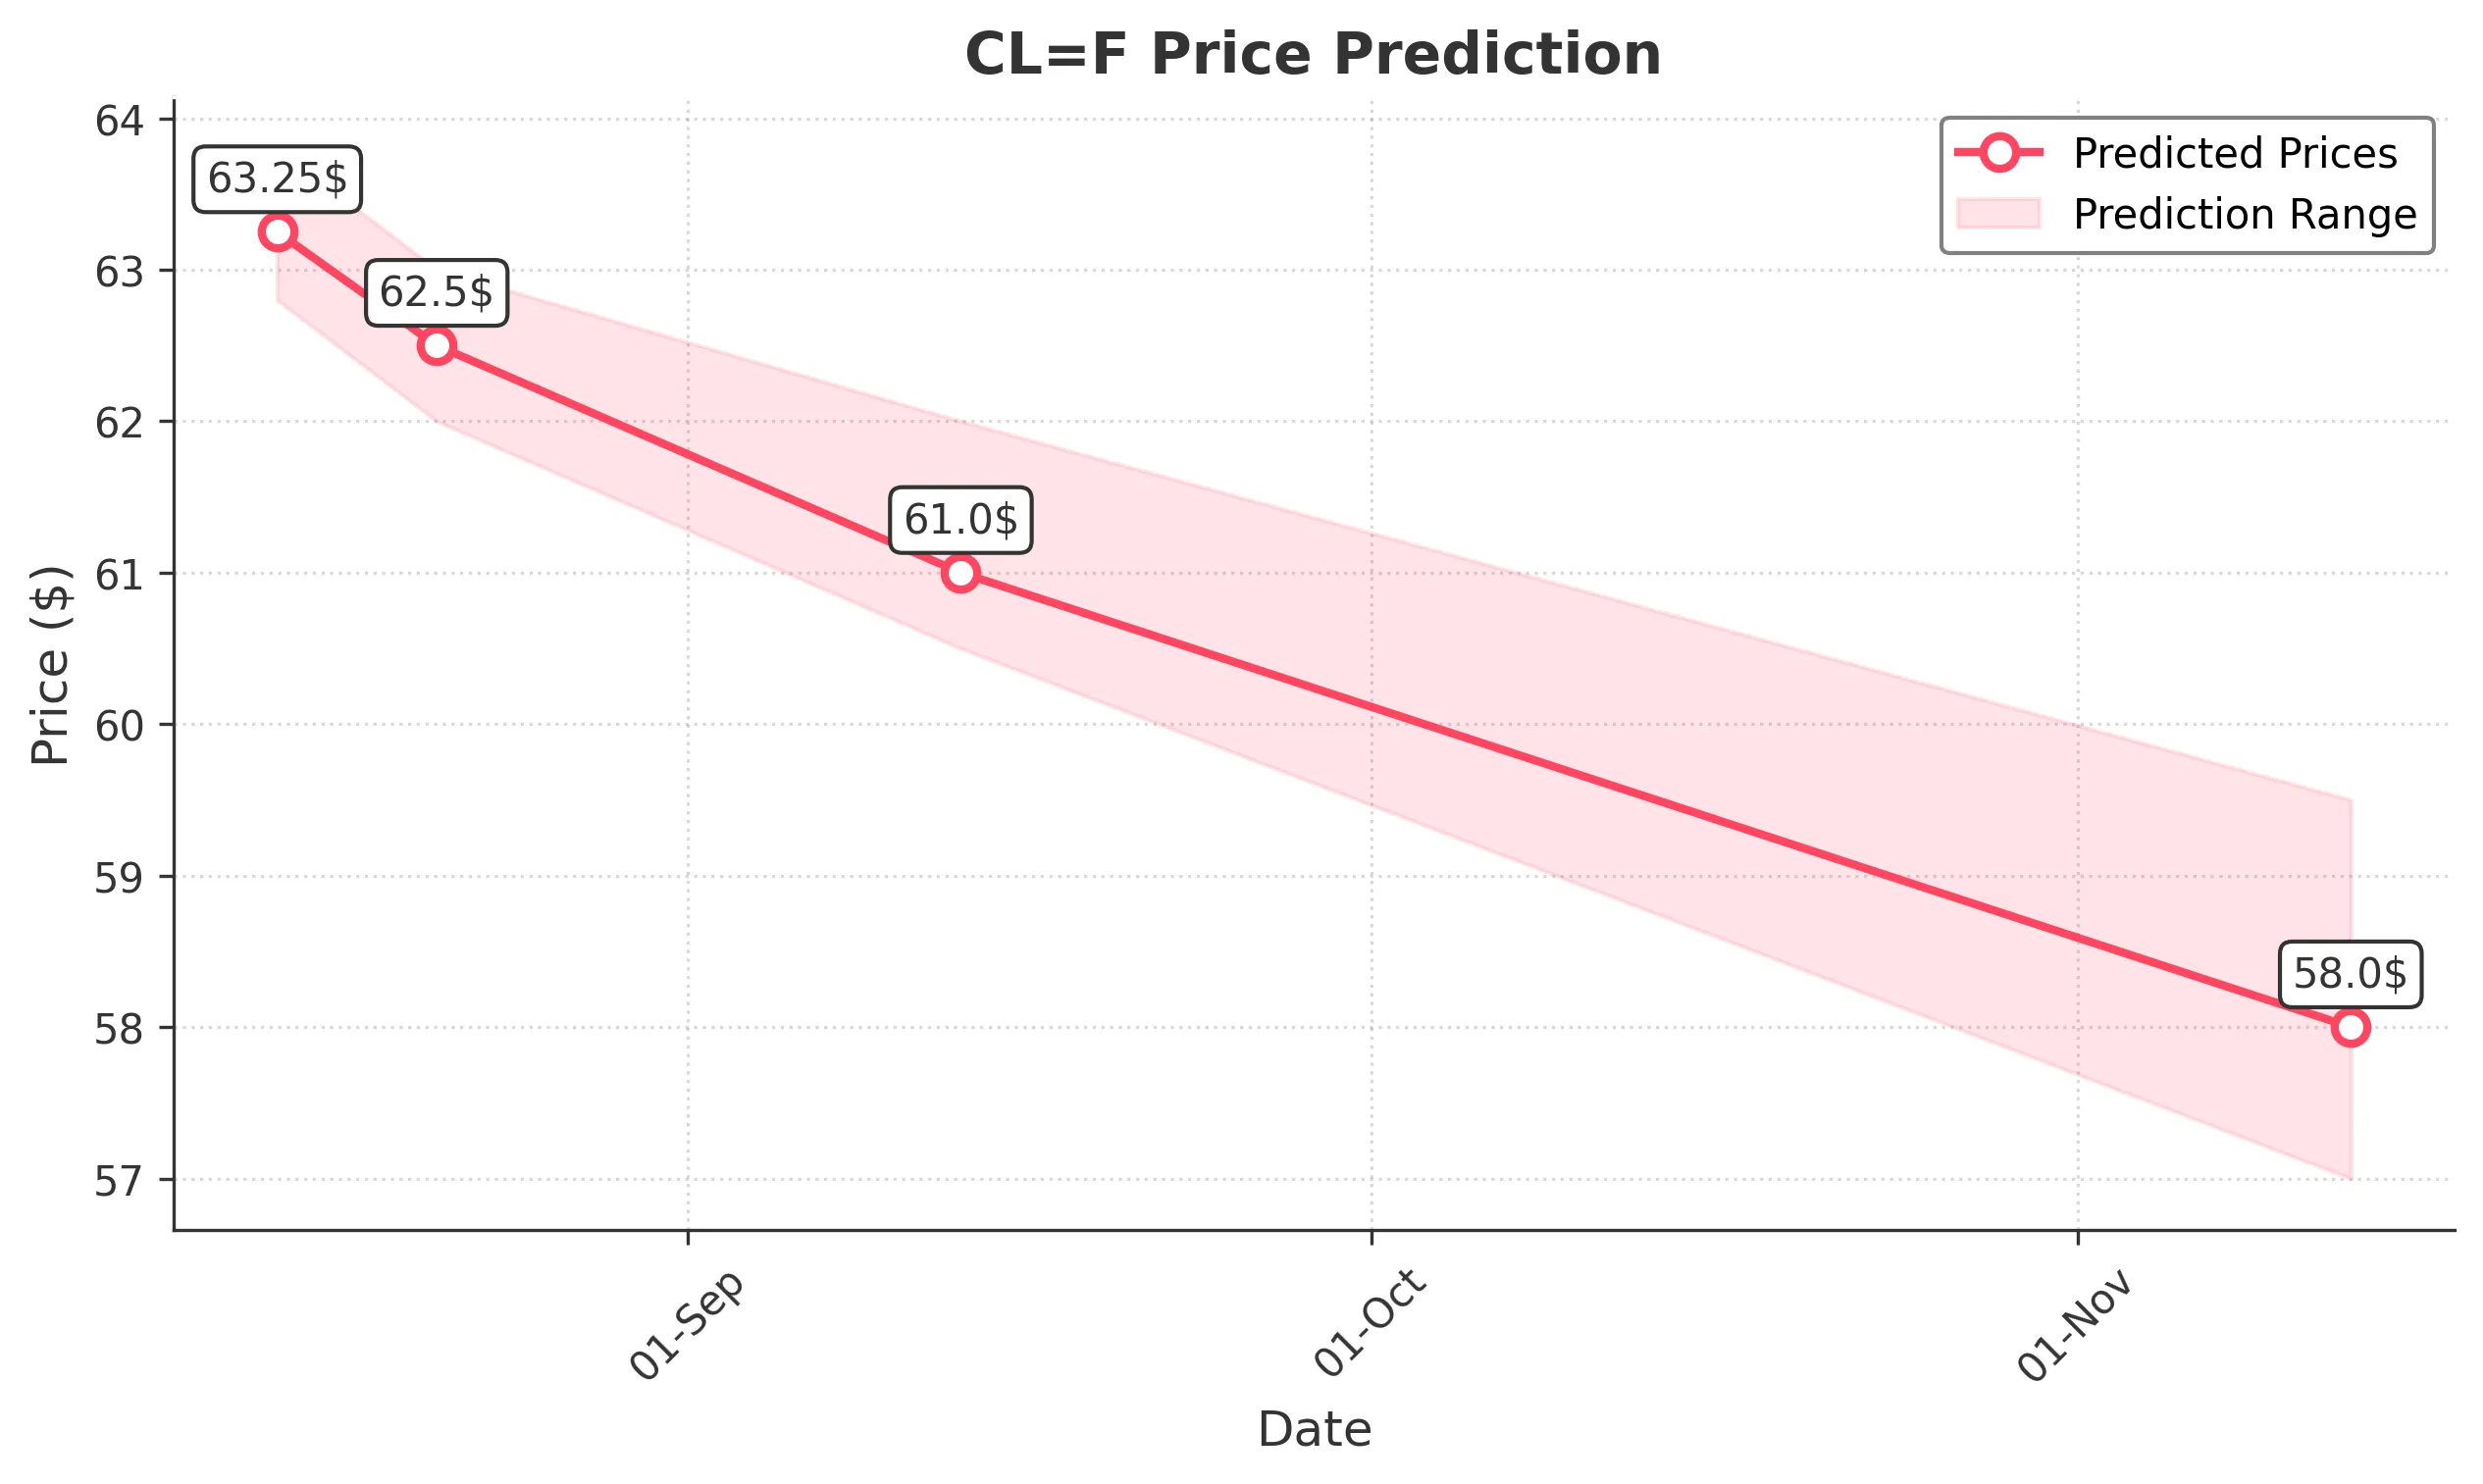
Target: August 14, 2025$63.25
$63.2
$63.8
$62.8
Description
The stock shows a slight bearish trend with a recent close of 63.19. RSI indicates overbought conditions, suggesting a potential pullback. Volume has decreased, indicating weakening momentum. Expect a close around 63.25.
Analysis
The stock has been in a bearish trend recently, with significant resistance at 64.00. The RSI is approaching overbought levels, and the MACD shows a bearish crossover. Volume has been declining, indicating a lack of buying interest.
Confidence Level
Potential Risks
Market volatility and external news could impact the prediction.
1 Week Prediction
Target: August 21, 2025$62.5
$62.8
$63
$62
Description
The bearish trend is expected to continue as the stock faces resistance at 63.50. The MACD is showing a bearish divergence, and the ATR indicates increasing volatility. Anticipate a close around 62.50.
Analysis
The stock has been trading sideways with a bearish bias. Key support is at 62.00, while resistance is at 63.50. The RSI is declining, indicating weakening momentum. Volume patterns suggest a lack of strong buying interest.
Confidence Level
Potential Risks
Potential market news or earnings reports could lead to unexpected price movements.
1 Month Prediction
Target: September 13, 2025$61
$62
$62
$60.5
Description
The stock is likely to continue its downward trend due to bearish sentiment and resistance at 63.00. The MACD remains negative, and the RSI indicates oversold conditions. Expect a close around 61.00.
Analysis
The stock has shown a consistent bearish trend over the past month. Key support is at 60.50, while resistance remains at 63.00. The ATR indicates increasing volatility, and the volume has been inconsistent, suggesting uncertainty.
Confidence Level
Potential Risks
Unforeseen macroeconomic events could significantly alter market conditions.
3 Months Prediction
Target: November 13, 2025$58
$59
$59.5
$57
Description
The stock is expected to decline further as bearish sentiment prevails. The MACD remains negative, and the RSI indicates oversold conditions. Anticipate a close around 58.00.
Analysis
The stock has been in a bearish trend, with significant resistance at 60.00. The RSI is indicating oversold conditions, but the MACD remains negative. Volume patterns suggest a lack of buying interest, indicating potential further declines.
Confidence Level
Potential Risks
Market conditions could change rapidly due to economic data releases or geopolitical events.