OIL Trading Predictions
1 Day Prediction
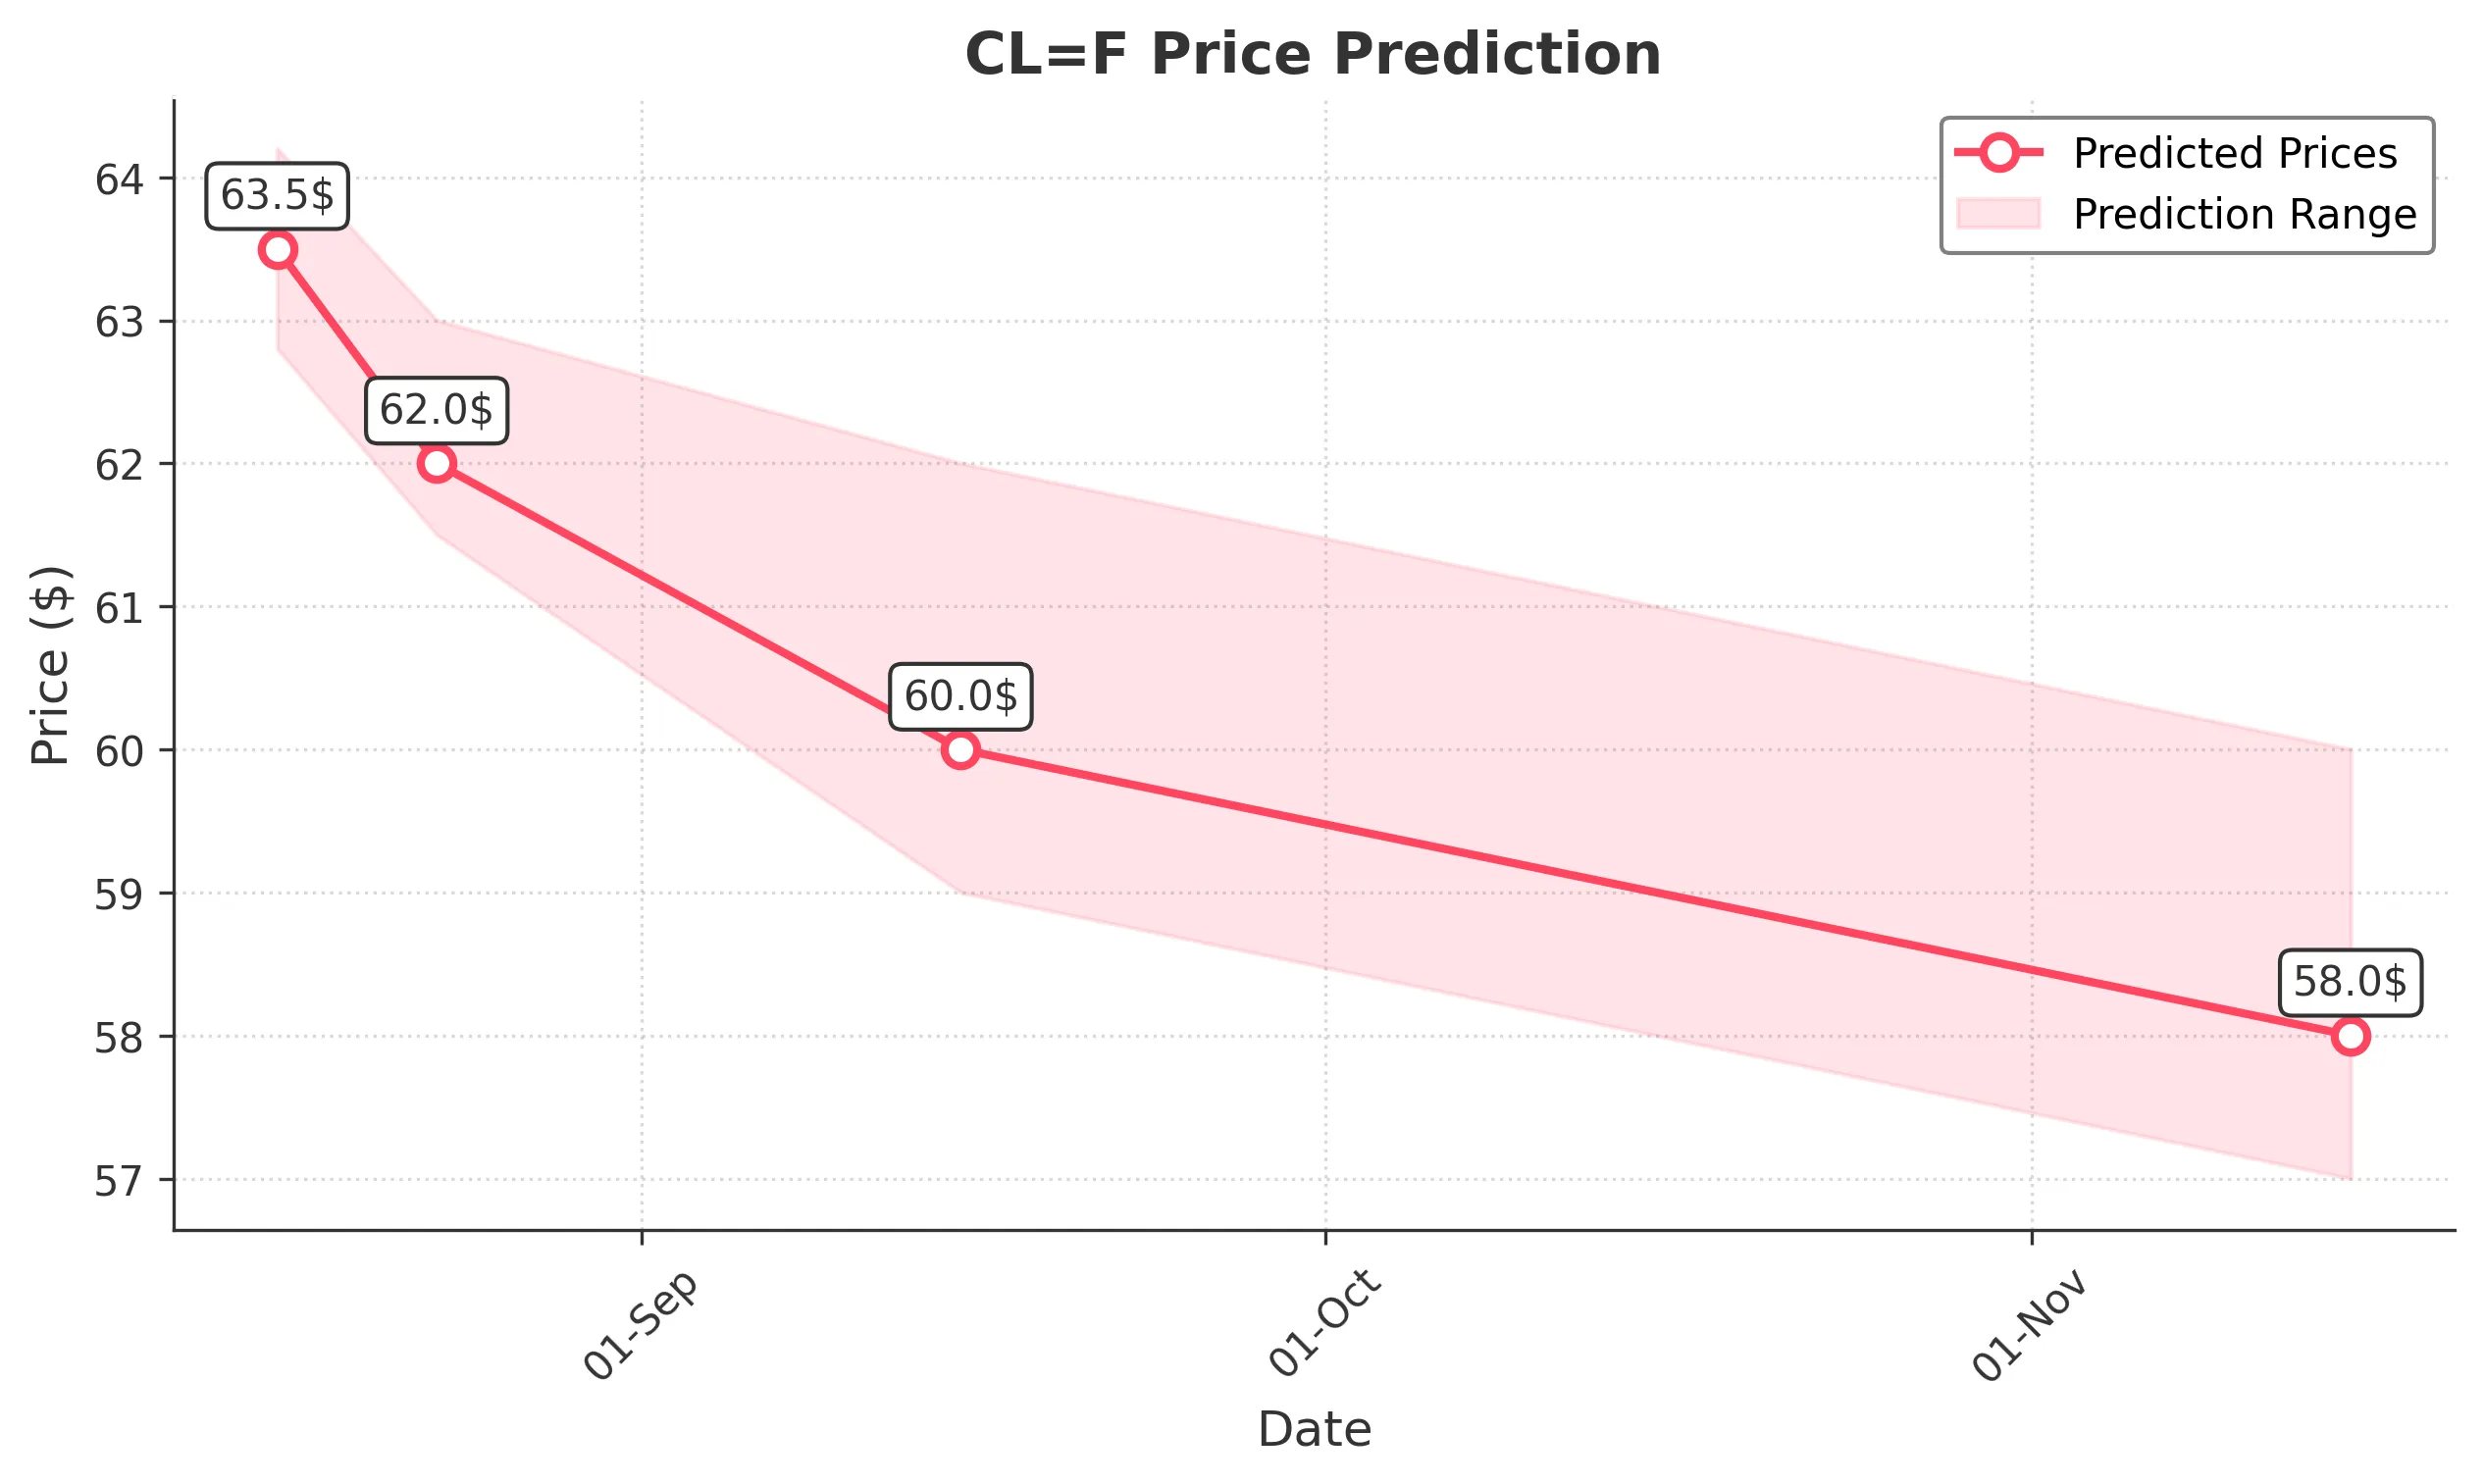
Target: August 16, 2025$63.5
$63.8
$64.2
$62.8
Description
The stock shows a slight bearish trend with recent lower closes. RSI indicates overbought conditions, suggesting a potential pullback. Volume has decreased, indicating weakening momentum. Expect a close around 63.50.
Analysis
Over the past 3 months, CL=F has shown a bullish trend with significant highs around 72.98. However, recent price action indicates a potential reversal with lower highs and lows. Key support at 63.00 and resistance at 65.00. Volume patterns suggest decreasing interest.
Confidence Level
Potential Risks
Market volatility and external news could impact the prediction. A sudden bullish sentiment could lead to higher prices.
1 Week Prediction
Target: August 23, 2025$62
$63
$63
$61.5
Description
The bearish trend is expected to continue as the stock faces resistance at 64.00. MACD shows a bearish crossover, and RSI is trending downwards. Anticipate a close around 62.00 as selling pressure increases.
Analysis
The stock has been in a corrective phase after reaching highs in June. The recent price action shows a series of lower highs, indicating bearish sentiment. Key support at 61.50 and resistance at 64.00. Volume has been declining, suggesting reduced buying interest.
Confidence Level
Potential Risks
Unexpected market news or economic data could shift sentiment rapidly, impacting the forecast.
1 Month Prediction
Target: September 15, 2025$60
$61.5
$62
$59
Description
Continued bearish momentum is expected, with potential for further declines. Fibonacci retracement levels suggest support around 60.00. Market sentiment remains cautious, and volume trends indicate a lack of buying interest.
Analysis
The stock has shown a bearish trend with significant resistance at 64.00. Recent price action indicates a struggle to maintain higher levels, with support at 60.00. Volume patterns suggest a lack of conviction in the current uptrend, indicating potential for further declines.
Confidence Level
Potential Risks
Economic indicators or geopolitical events could lead to unexpected volatility, affecting the price direction.
3 Months Prediction
Target: November 15, 2025$58
$59
$60
$57
Description
The stock is likely to continue its downward trajectory, with key support at 58.00. Technical indicators suggest a bearish outlook, and market sentiment remains weak. Expect a close around 58.00 as selling pressure persists.
Analysis
Over the past three months, CL=F has experienced significant volatility, with a bearish trend emerging after reaching highs in June. Key support levels are being tested, and the overall market sentiment is cautious. Volume patterns indicate a lack of strong buying interest, suggesting further declines may be on the horizon.
Confidence Level
Potential Risks
Market conditions can change rapidly, and any positive news could reverse the trend. Economic data releases may also impact the stock's performance.