SIF Trading Predictions
1 Day Prediction
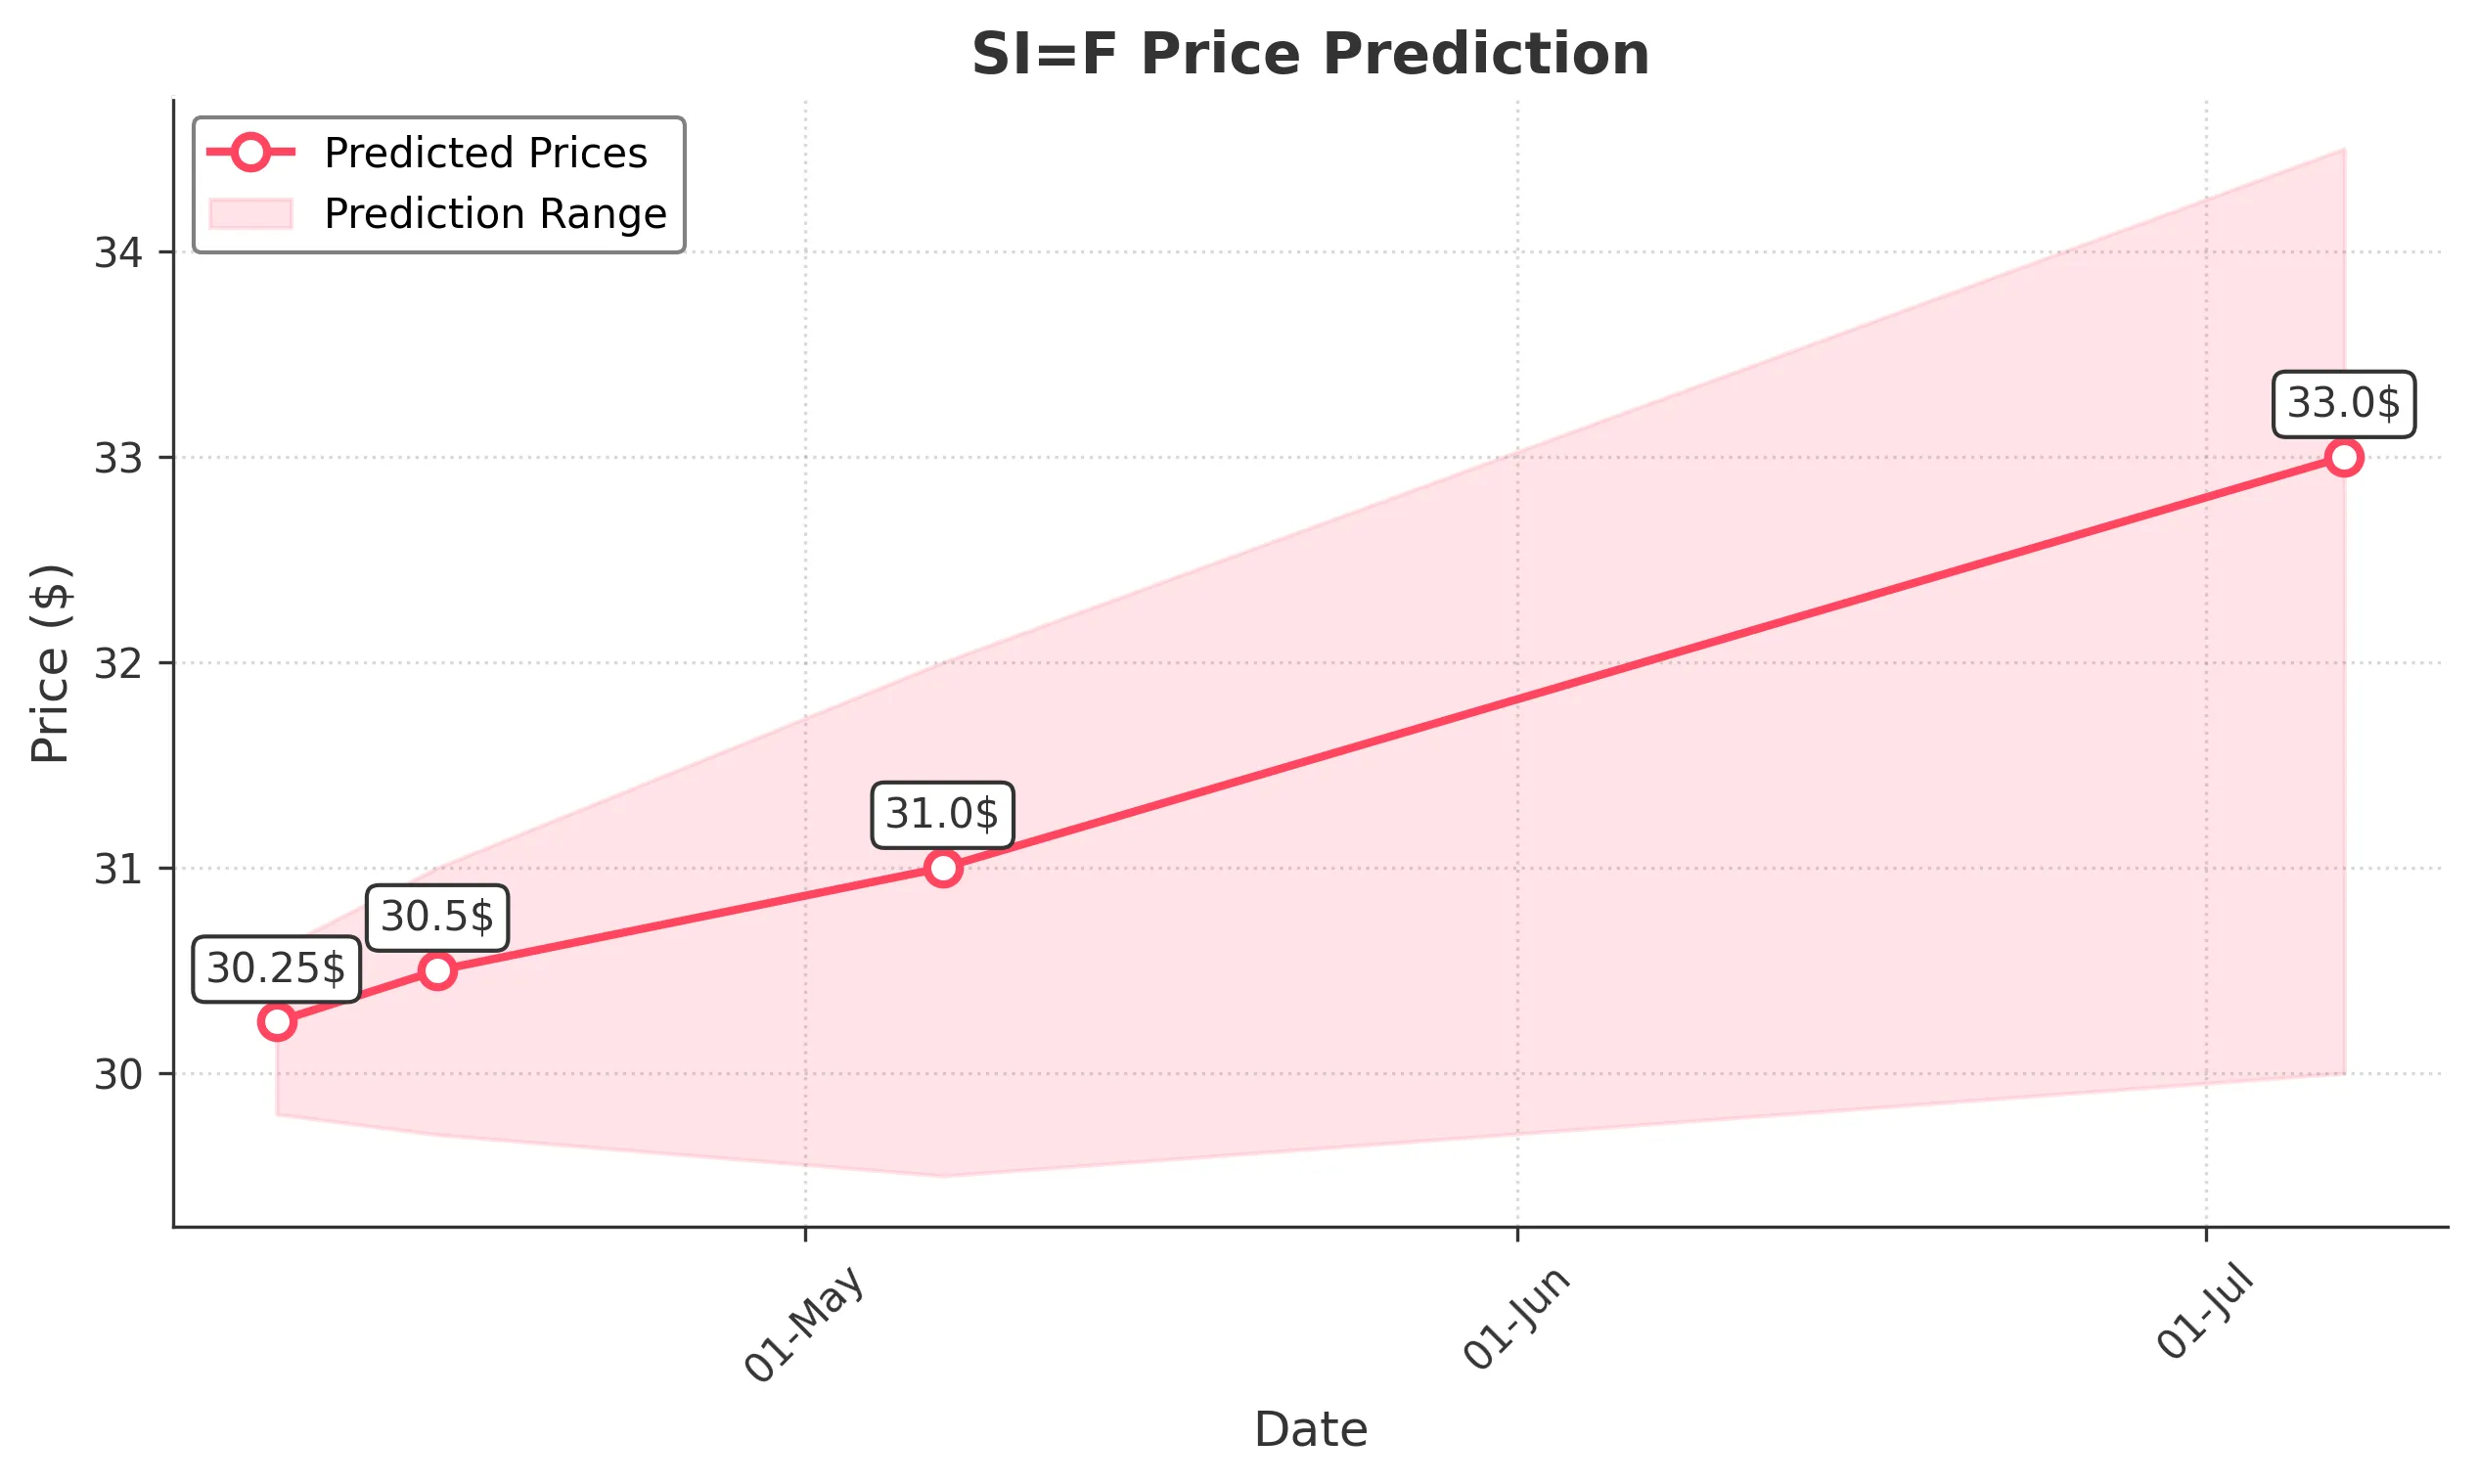
Target: April 8, 2025$30.25
$30
$30.6
$29.8
Description
The stock shows bearish momentum with a recent drop. RSI indicates oversold conditions, but a potential bounce could occur. MACD is bearish, and volume spikes suggest selling pressure. Expect a close around 30.250.
Analysis
Over the past 3 months, SI=F has shown a bearish trend, especially in the last week. Key support at 29.00 is critical. Technical indicators like MACD and RSI suggest weakness, while volume spikes indicate selling pressure. The market sentiment is cautious.
Confidence Level
Potential Risks
Market volatility and external news could impact the prediction. A reversal is possible if bullish sentiment returns.
1 Week Prediction
Target: April 15, 2025$30.5
$30.3
$31
$29.7
Description
A slight recovery is anticipated as the stock may find support around 29.00. RSI could improve, indicating a potential reversal. However, bearish MACD signals persist, suggesting caution.
Analysis
The stock has been in a downtrend, with significant resistance at 31.00. Recent volume patterns show increased selling. Technical indicators suggest a potential short-term recovery, but overall sentiment remains bearish.
Confidence Level
Potential Risks
Unforeseen market events or economic data releases could lead to further declines. The bearish trend remains a concern.
1 Month Prediction
Target: May 7, 2025$31
$30.8
$32
$29.5
Description
Expect a gradual recovery as the stock stabilizes. RSI may return to neutral levels, and MACD could show signs of bullish divergence. However, resistance at 32.00 remains a challenge.
Analysis
The stock has faced significant selling pressure, with key support at 29.00. Technical indicators suggest potential stabilization, but the overall trend remains bearish. Volume analysis indicates cautious trading.
Confidence Level
Potential Risks
Market conditions and economic indicators could shift sentiment quickly. A failure to break resistance may lead to further declines.
3 Months Prediction
Target: July 7, 2025$33
$32.5
$34.5
$30
Description
A recovery trend may develop if the stock breaks above 32.00. Positive market sentiment and improved economic conditions could support this. However, volatility remains a concern.
Analysis
The stock has been volatile, with a bearish trend recently. Key resistance at 32.00 and support at 29.00 are critical. Technical indicators suggest potential for recovery, but external factors could influence performance.
Confidence Level
Potential Risks
Long-term predictions are uncertain due to potential market shifts and economic factors. A bearish trend could resume if resistance levels hold.