SIF Trading Predictions
1 Day Prediction
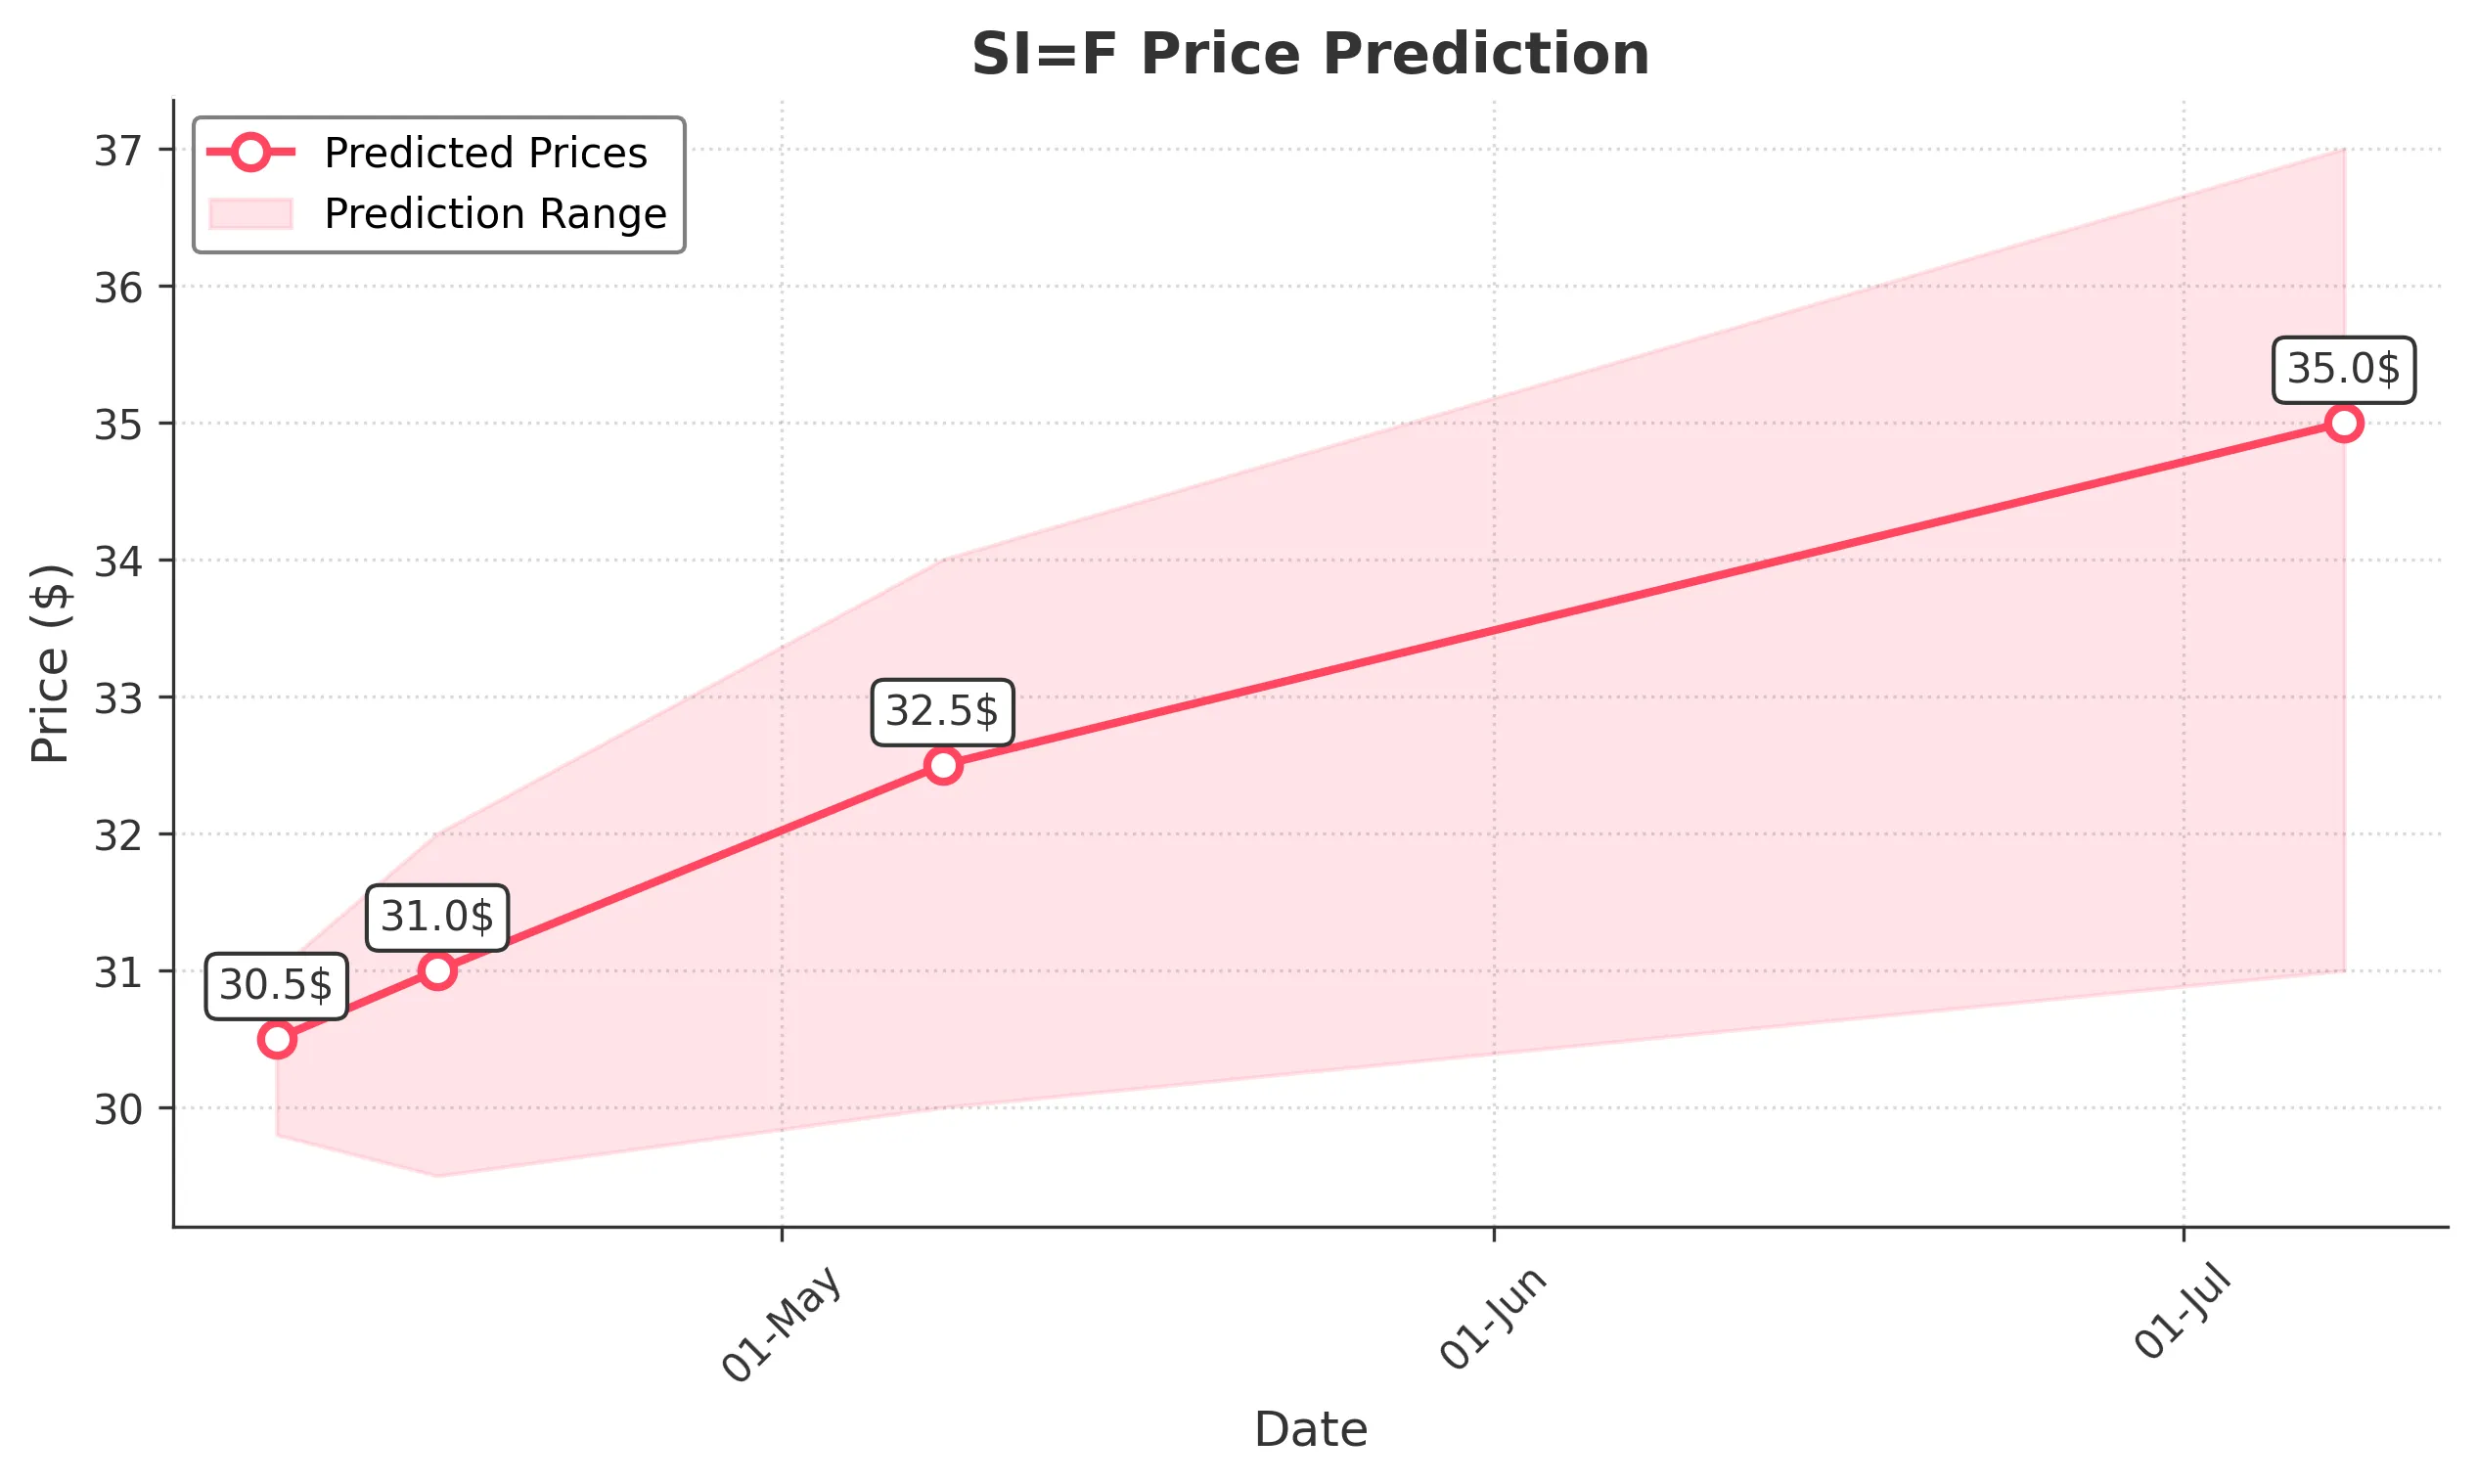
Target: April 9, 2025$30.5
$30.2
$31
$29.8
Description
The stock shows a slight recovery potential after recent declines. RSI indicates oversold conditions, while MACD suggests a bullish crossover. However, recent volatility and bearish sentiment may limit upside.
Analysis
Over the past 3 months, SI=F has shown a bearish trend with significant support around 29.00. Recent price action indicates volatility, with a potential reversal pattern forming. Volume spikes on down days suggest selling pressure.
Confidence Level
Potential Risks
Market sentiment remains cautious, and any negative news could lead to further declines.
1 Week Prediction
Target: April 16, 2025$31
$30.8
$32
$29.5
Description
A potential rebound is expected as the stock approaches key support levels. The Bollinger Bands indicate a squeeze, suggesting a breakout could occur. However, macroeconomic factors may still weigh on performance.
Analysis
The stock has been in a downtrend, but recent price action shows signs of stabilization. Key resistance is at 32.00, while support remains at 29.00. Volume analysis indicates a lack of conviction in the current trend.
Confidence Level
Potential Risks
Uncertainty in the broader market and potential earnings reports could impact stock performance.
1 Month Prediction
Target: May 8, 2025$32.5
$31.5
$34
$30
Description
Expect a gradual recovery as the stock tests resistance levels. The MACD shows potential bullish momentum, and the RSI is moving towards neutral territory. However, external economic factors could hinder growth.
Analysis
The stock has experienced significant fluctuations, with a bearish trend recently. Key resistance at 34.00 and support at 30.00 are critical. Technical indicators suggest a potential reversal, but caution is warranted.
Confidence Level
Potential Risks
Economic indicators and market sentiment could lead to unexpected volatility.
3 Months Prediction
Target: July 8, 2025$35
$34
$37
$31
Description
Longer-term outlook appears bullish as the stock may break through resistance levels. Positive market sentiment and potential earnings growth could drive prices higher, but macroeconomic risks remain.
Analysis
The stock has shown resilience despite recent declines. A bullish trend may emerge if it can maintain above 34.00. Key support at 31.00 and resistance at 37.00 will be crucial in determining future price action.
Confidence Level
Potential Risks
Potential market corrections and economic downturns could impact the stock's performance.