SIF Trading Predictions
1 Day Prediction
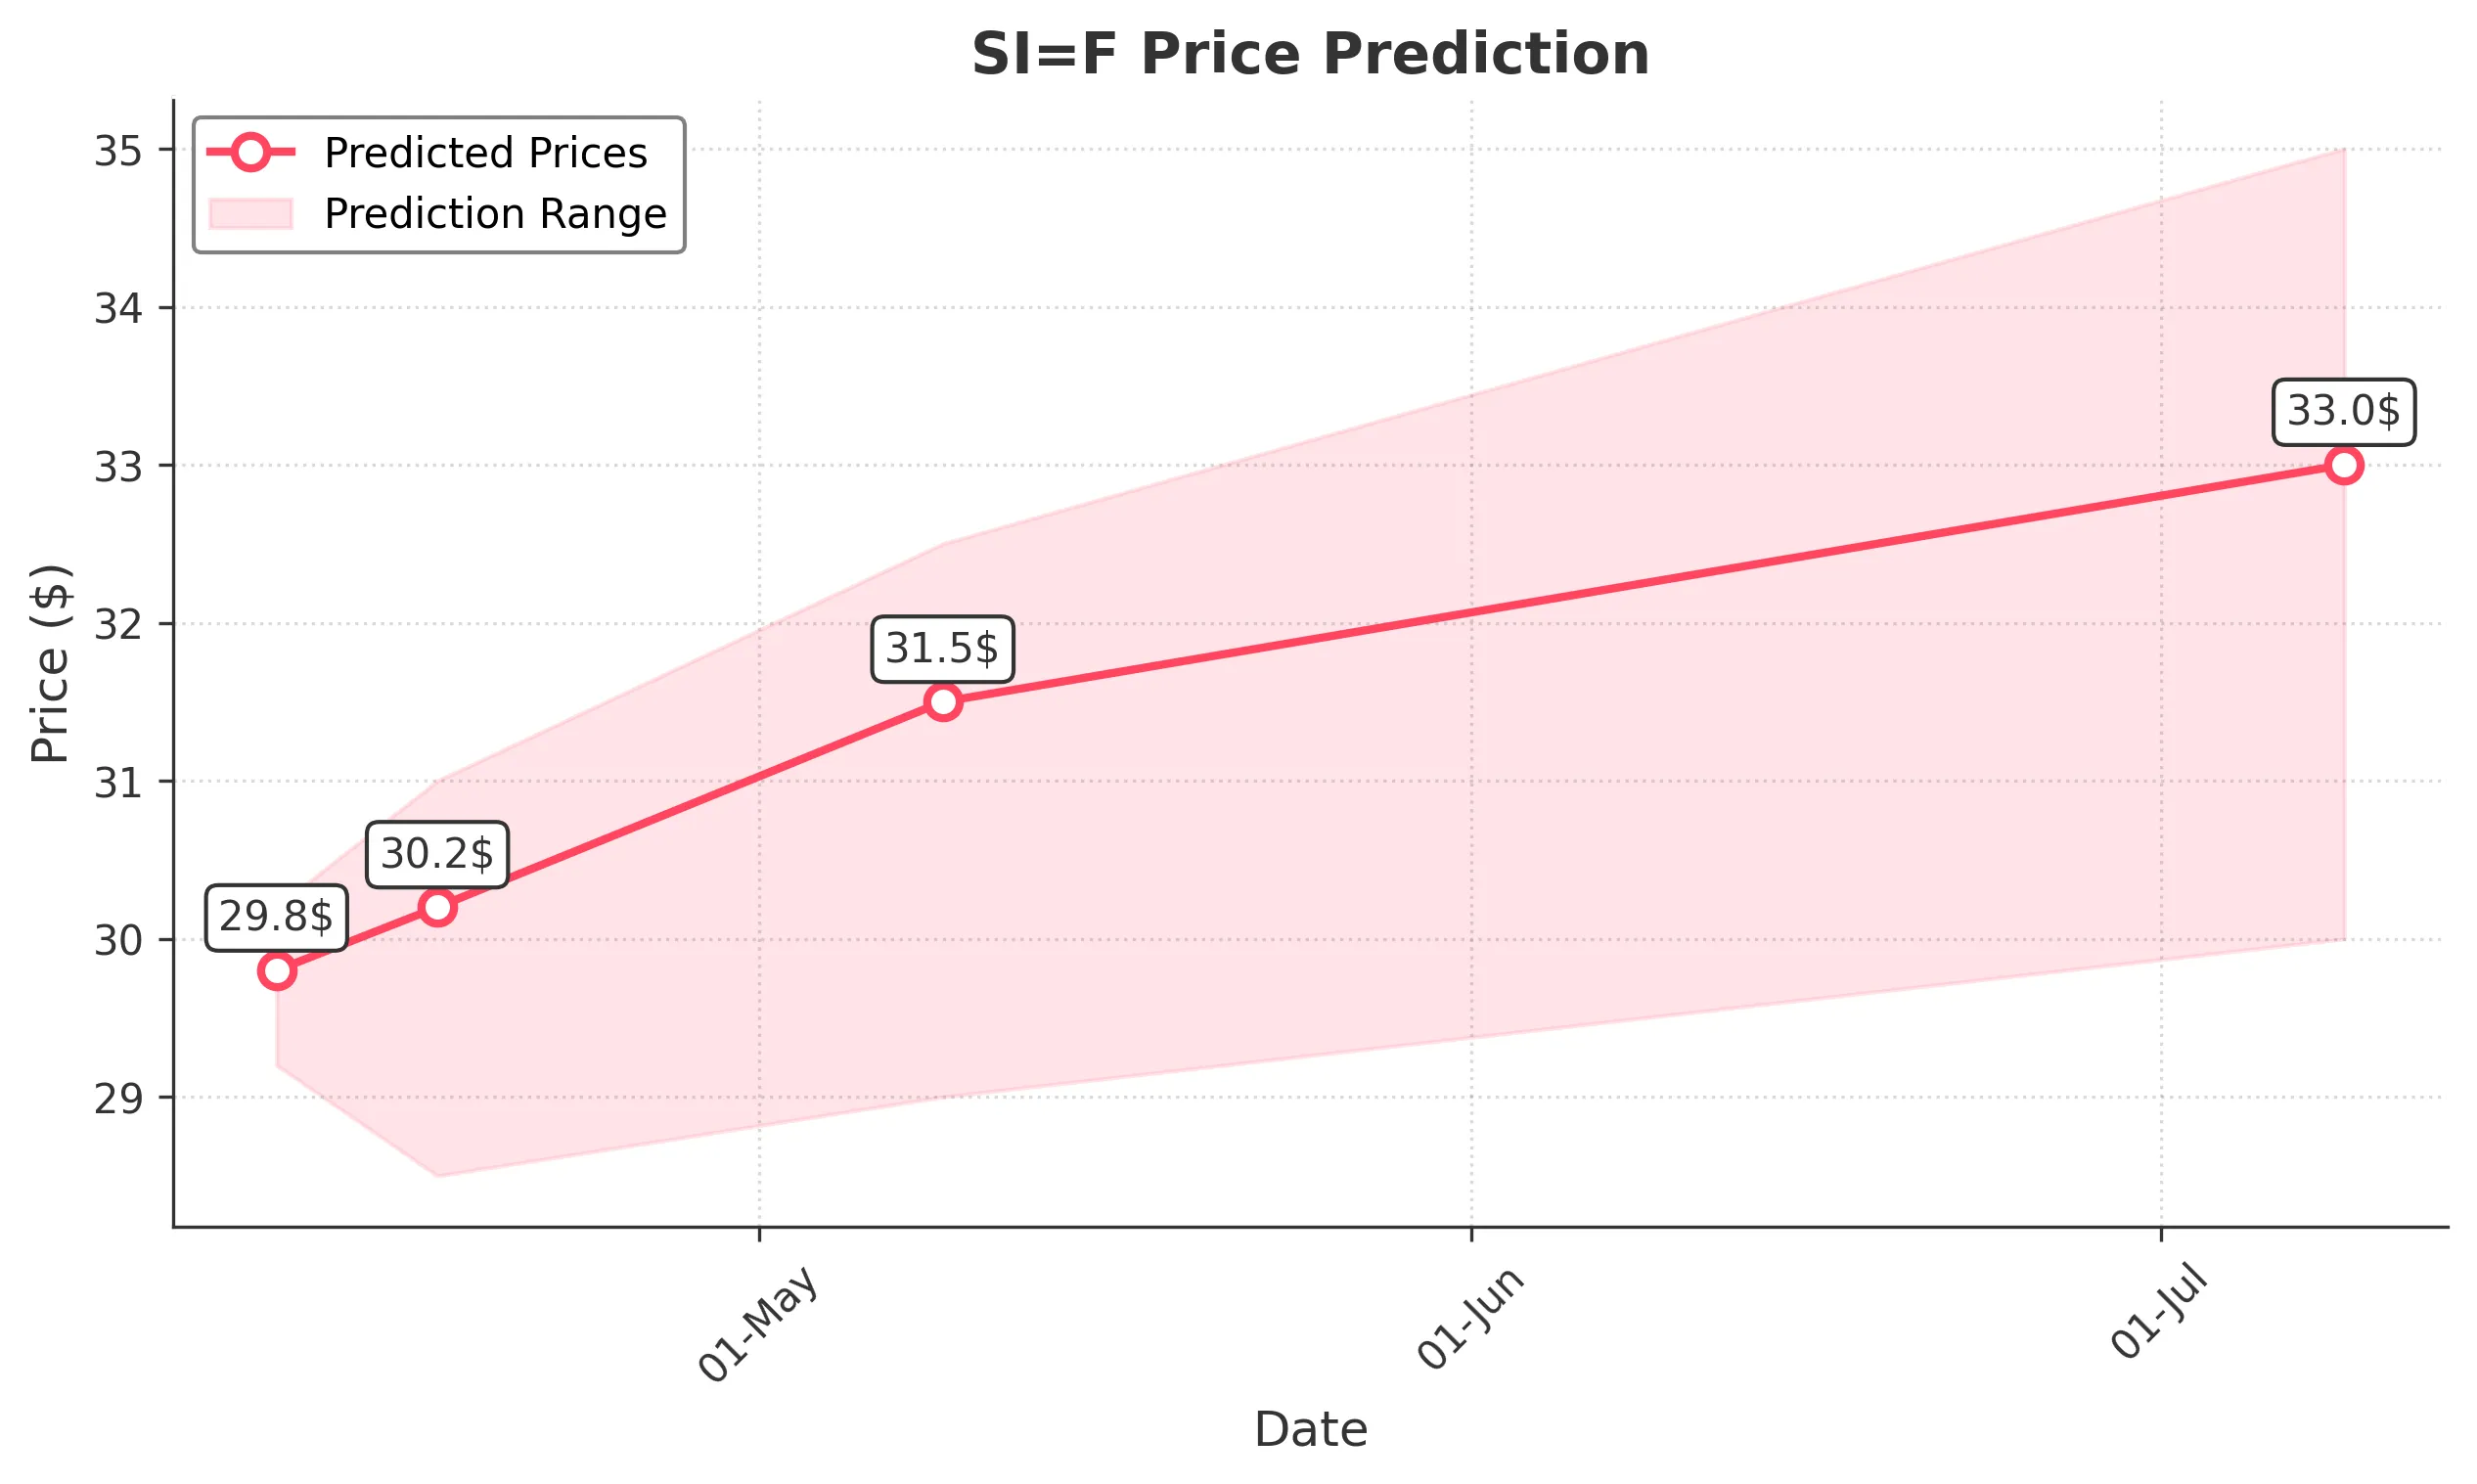
Target: April 10, 2025$29.8
$29.75
$30.2
$29.2
Description
The stock shows bearish momentum with a recent drop in price and volume spikes indicating selling pressure. RSI is approaching oversold levels, suggesting a potential short-term bounce, but overall sentiment remains negative.
Analysis
Over the past 3 months, SI=F has shown a bearish trend, particularly in the last few weeks with significant declines. Key support is around 29.00, while resistance is at 34.00. Volume has been inconsistent, with spikes indicating selling pressure. Technical indicators like MACD and RSI suggest a potential reversal, but caution is warranted.
Confidence Level
Potential Risks
Market volatility and potential news could impact the stock's performance unexpectedly.
1 Week Prediction
Target: April 17, 2025$30.2
$29.8
$31
$28.5
Description
A slight recovery is anticipated as the stock may find support near 29.00. However, bearish sentiment persists, and any upward movement could be limited by resistance at 31.00. Watch for volume trends to confirm direction.
Analysis
The stock has been in a downtrend, with recent lows indicating weakness. Support at 29.00 is critical, while resistance at 31.00 may cap any recovery. Technical indicators show mixed signals, with potential for a short-term bounce but overall bearish sentiment remains.
Confidence Level
Potential Risks
Unforeseen macroeconomic events or earnings reports could lead to increased volatility.
1 Month Prediction
Target: May 9, 2025$31.5
$30.2
$32.5
$29
Description
Expect a gradual recovery as the stock may stabilize around 30.00. If it breaks above 31.00, further gains could be possible. However, the overall trend remains cautious due to recent declines.
Analysis
The stock has faced significant selling pressure, with a bearish trend dominating. Key support at 29.00 and resistance at 34.00 are critical levels. Technical indicators suggest potential for a recovery, but caution is advised as the market remains volatile.
Confidence Level
Potential Risks
Market sentiment and external factors could lead to further declines, impacting the recovery.
3 Months Prediction
Target: July 9, 2025$33
$31.5
$35
$30
Description
A more optimistic outlook as the stock may recover towards 33.00 if it can maintain above 30.00. However, the potential for further declines exists if bearish sentiment continues.
Analysis
The stock's performance has been bearish recently, with significant declines. Key support at 29.00 and resistance at 34.00 are crucial. While there is potential for recovery, the overall market sentiment remains cautious, and external factors could impact future performance.
Confidence Level
Potential Risks
Long-term trends are uncertain, and macroeconomic factors could heavily influence performance.