SIF Trading Predictions
1 Day Prediction
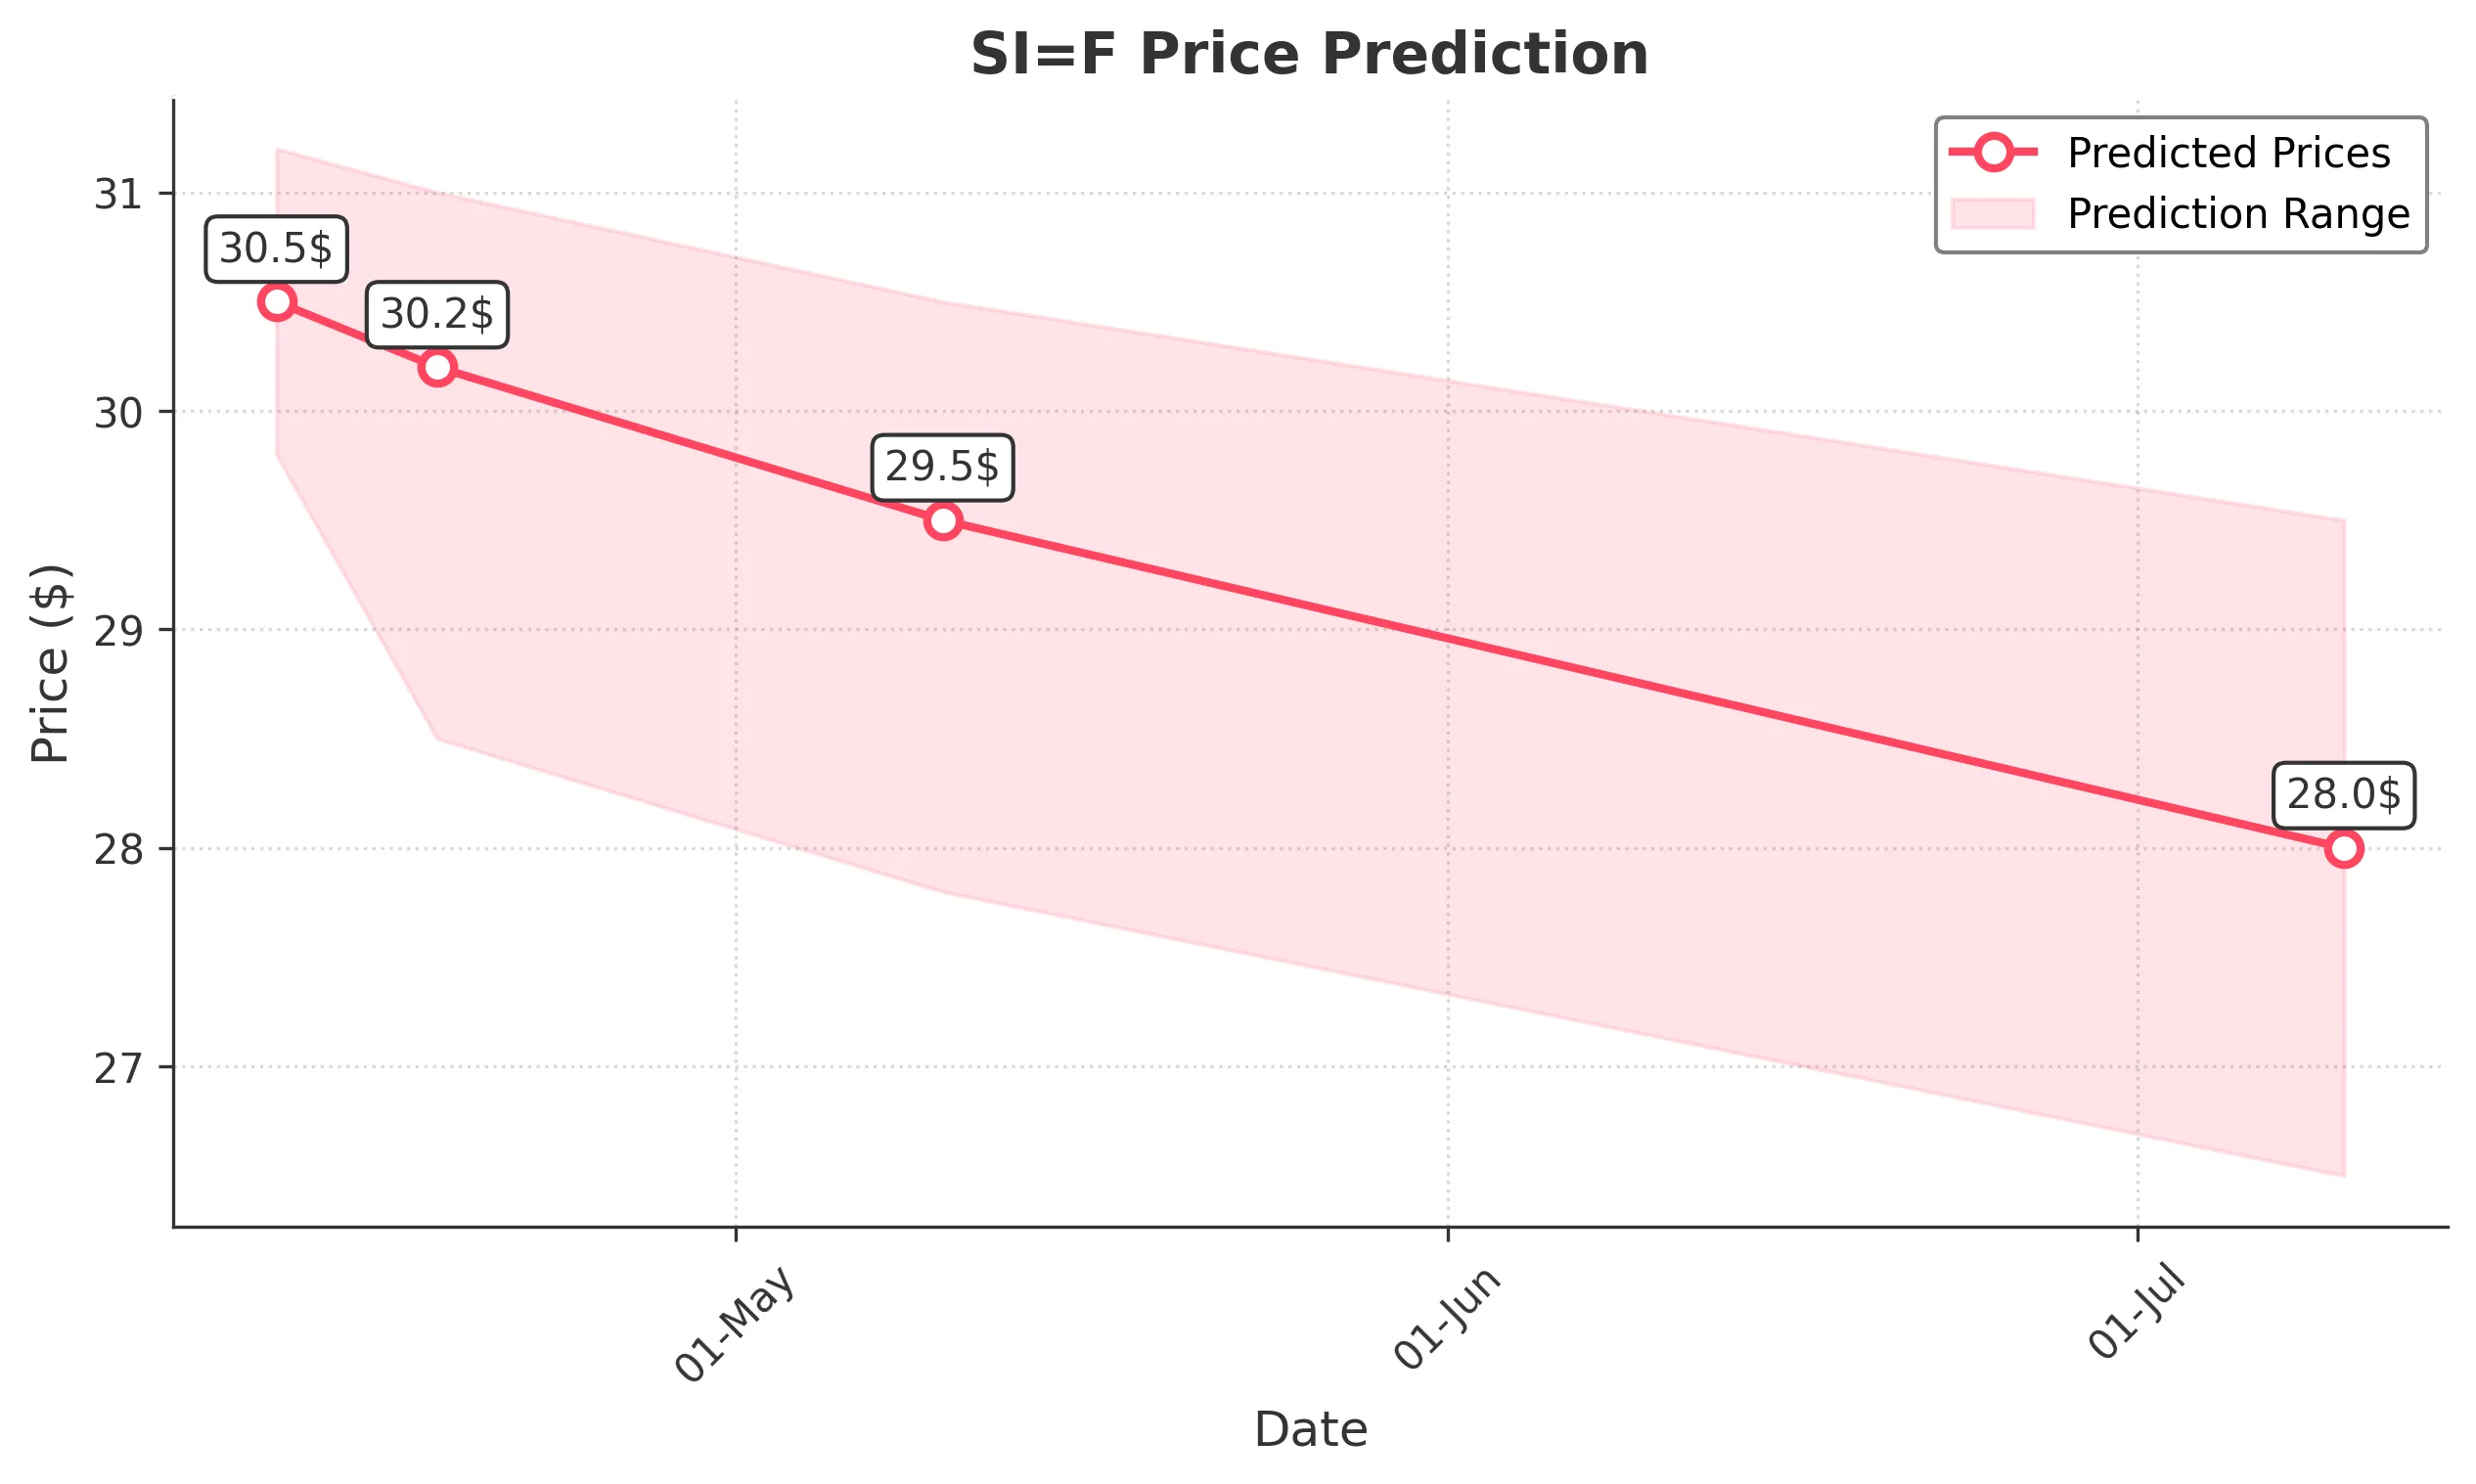
Target: April 11, 2025$30.5
$30.8
$31.2
$29.8
Description
The stock shows a bearish trend with recent declines. RSI indicates oversold conditions, suggesting a potential bounce. However, the MACD is bearish, and volume has been low, indicating weak buying interest.
Analysis
Over the past 3 months, SI=F has shown a bearish trend, particularly in April. Key support is around 29.00, while resistance is at 34.00. The recent drop in volume suggests a lack of conviction in the current price levels.
Confidence Level
Potential Risks
Market volatility and external news could impact the prediction. A sudden positive catalyst could reverse the trend.
1 Week Prediction
Target: April 18, 2025$30.2
$30.4
$31
$28.5
Description
The bearish momentum may continue, with potential for a slight recovery. The Bollinger Bands indicate a squeeze, suggesting volatility ahead. However, the overall trend remains downward.
Analysis
The stock has been in a downtrend, with significant resistance at 31.00. The ATR indicates increasing volatility, and the recent candlestick patterns show indecision, which could lead to further declines.
Confidence Level
Potential Risks
Unforeseen market events or earnings reports could lead to unexpected price movements.
1 Month Prediction
Target: May 10, 2025$29.5
$30
$30.5
$27.8
Description
Continued bearish sentiment is expected, with potential for further declines. The Fibonacci retracement levels suggest support around 28.00, which may be tested.
Analysis
The stock has been under pressure, with key support at 28.00. The RSI is approaching oversold levels, indicating a potential bounce, but the overall trend remains bearish.
Confidence Level
Potential Risks
Market sentiment can shift quickly, and any positive news could lead to a reversal.
3 Months Prediction
Target: July 10, 2025$28
$28.5
$29.5
$26.5
Description
The bearish trend may persist, with potential for further declines. The market sentiment remains cautious, and external economic factors could weigh heavily on the stock.
Analysis
The stock has shown a consistent downtrend, with significant resistance at 30.00. The overall market sentiment is bearish, and macroeconomic factors could further impact performance.
Confidence Level
Potential Risks
Economic indicators and market conditions could change, leading to unexpected price movements.