SIF Trading Predictions
1 Day Prediction
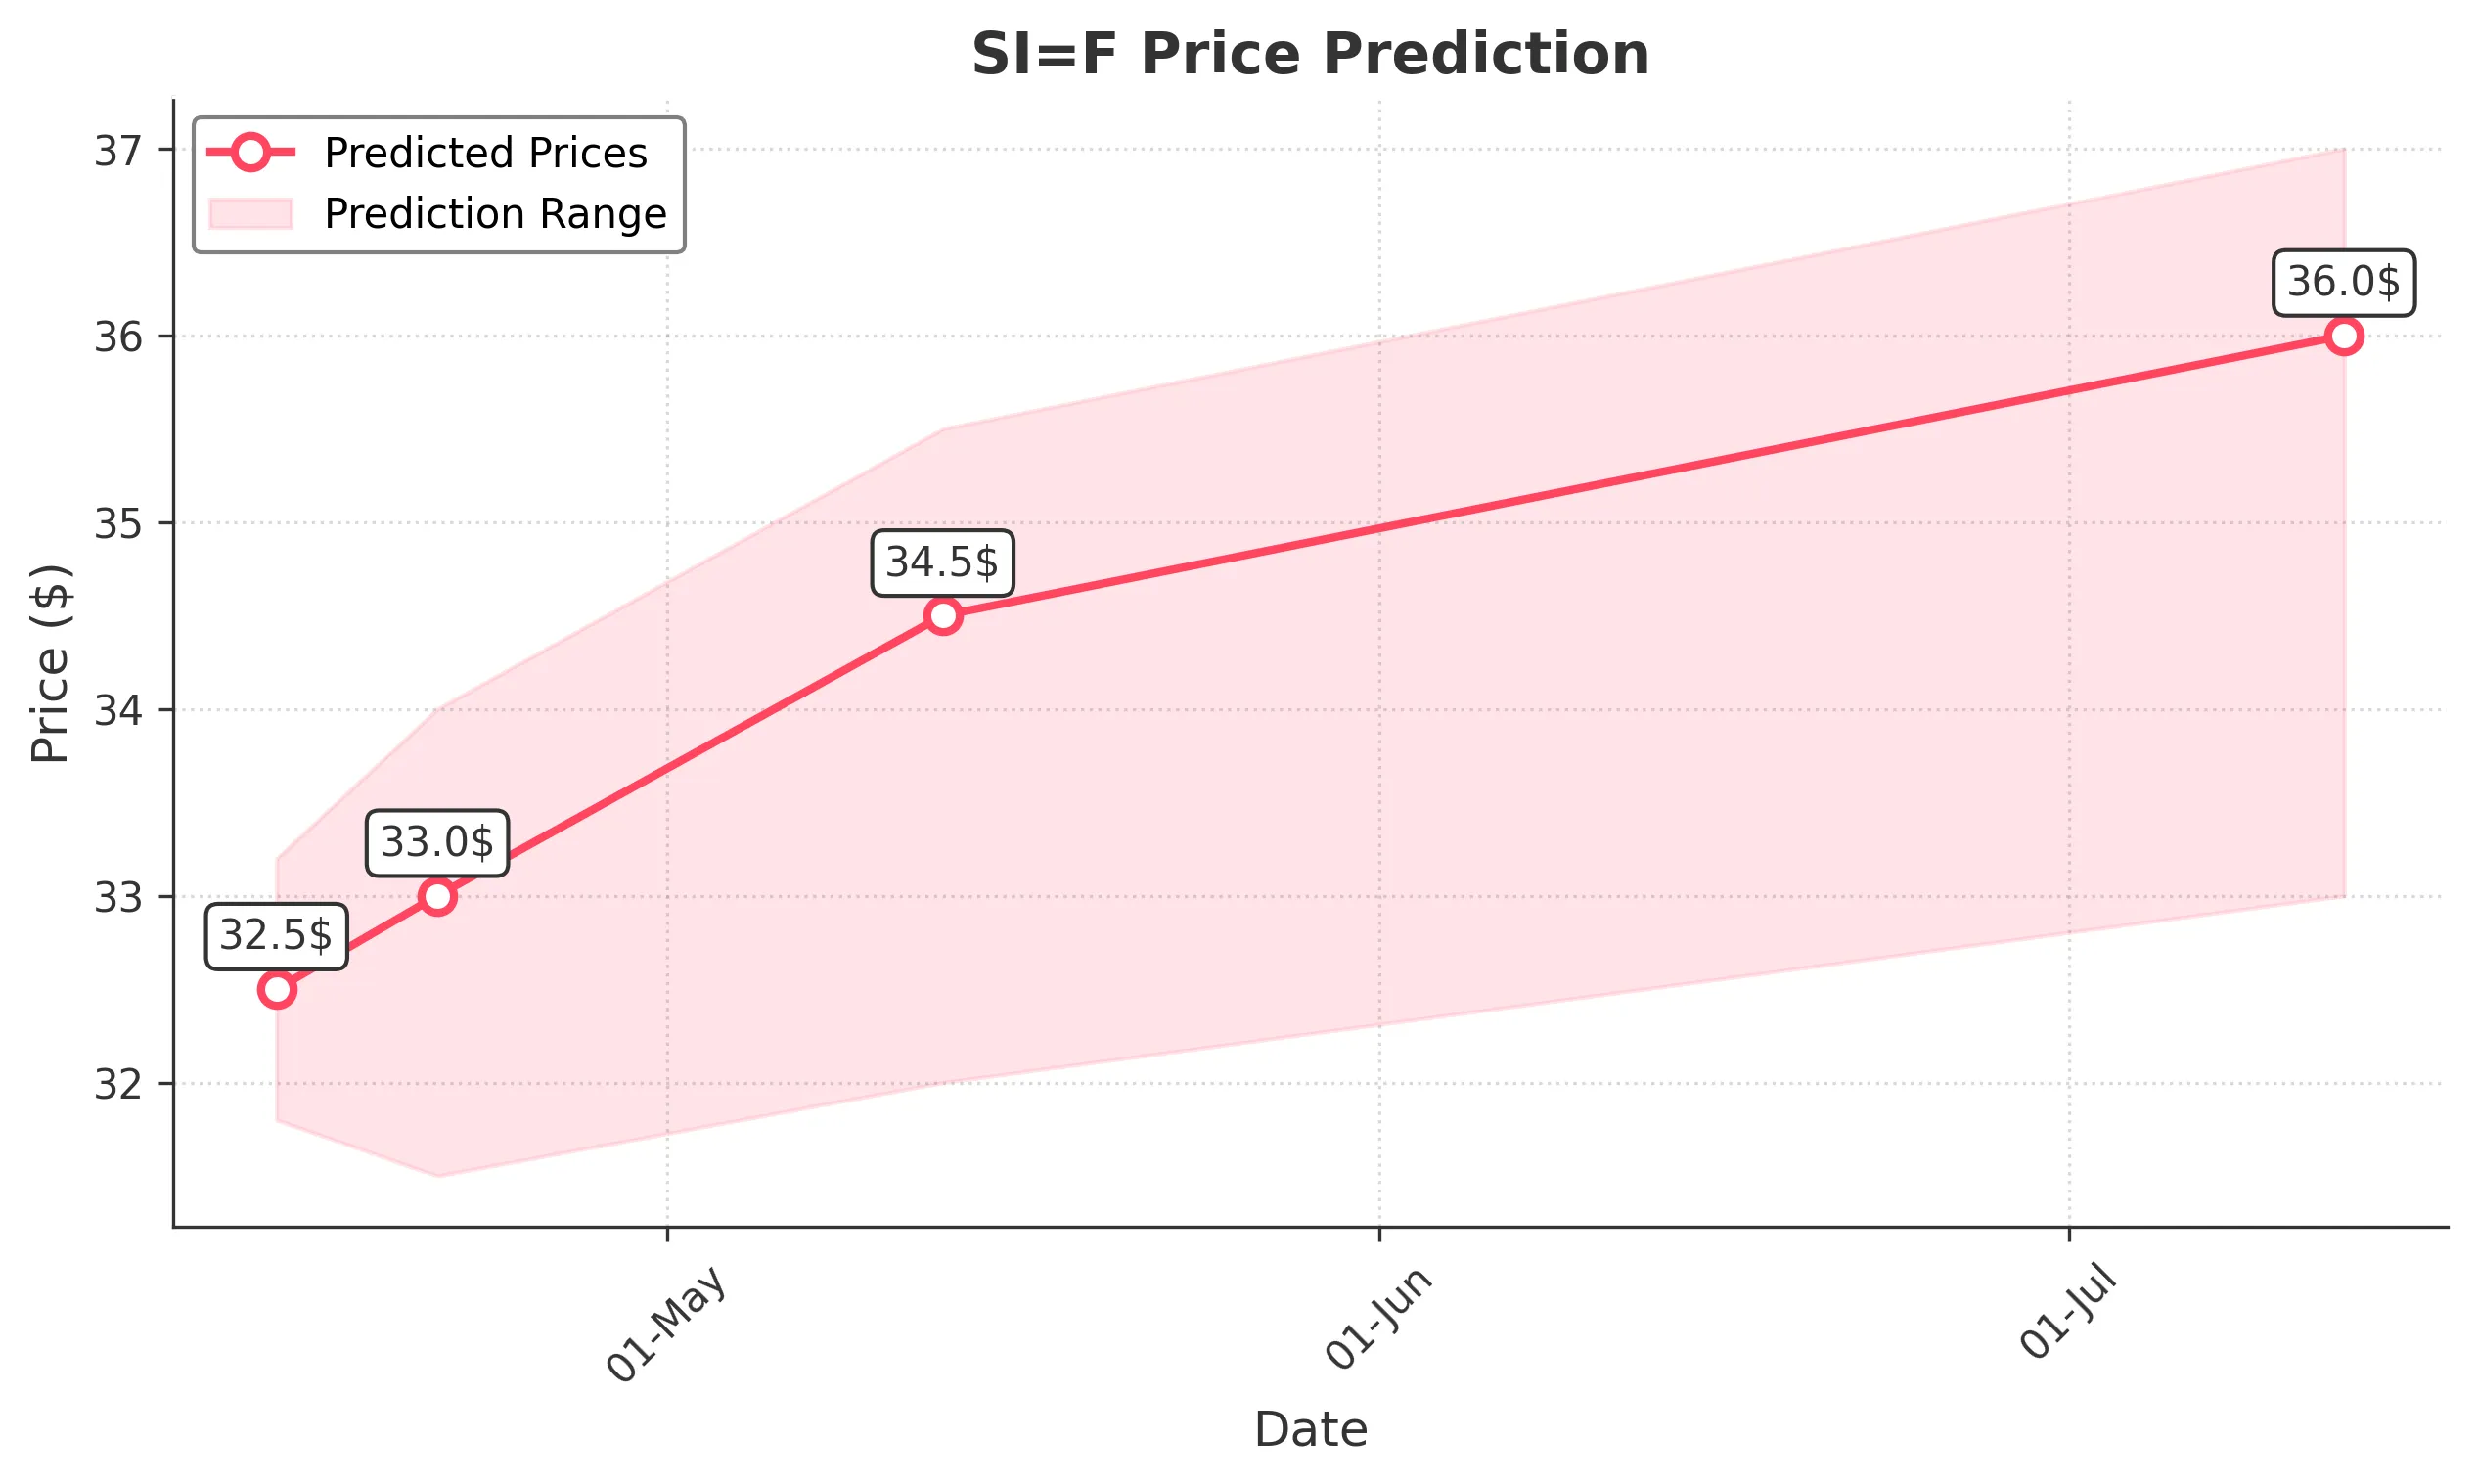
Target: April 14, 2025$32.5
$32
$33.2
$31.8
Description
The stock shows a potential rebound after recent declines, supported by a bullish candlestick pattern. RSI indicates oversold conditions, suggesting a possible upward correction. However, market sentiment remains cautious due to recent volatility.
Analysis
Over the past 3 months, SI=F has experienced significant fluctuations, with a recent bearish trend. Key support is around 29.1, while resistance is near 34.5. The RSI is currently low, indicating potential for a bounce, but MACD shows bearish momentum. Volume has been inconsistent, suggesting uncertainty.
Confidence Level
Potential Risks
Market volatility and external news could impact the prediction. A sudden downturn is possible if selling pressure resumes.
1 Week Prediction
Target: April 21, 2025$33
$32.5
$34
$31.5
Description
A potential recovery is anticipated as the stock approaches key Fibonacci retracement levels. The recent bullish candlestick patterns suggest a reversal, but caution is warranted due to overall market sentiment and macroeconomic factors.
Analysis
The stock has shown a bearish trend recently, with significant support at 29.1. The RSI is improving, indicating a potential reversal. However, the MACD remains bearish, and volume spikes suggest uncertainty. The market sentiment is mixed, influenced by broader economic conditions.
Confidence Level
Potential Risks
Unforeseen macroeconomic events or earnings reports could lead to volatility, impacting the stock's recovery trajectory.
1 Month Prediction
Target: May 13, 2025$34.5
$33
$35.5
$32
Description
If the bullish momentum continues, the stock could reach higher levels, supported by positive market sentiment and potential recovery in the broader market. However, resistance levels will need to be monitored closely.
Analysis
The stock has been volatile, with a recent bearish trend. Key resistance is at 34.5, while support is at 29.1. The RSI is improving, but MACD indicates bearish momentum. Volume patterns suggest uncertainty, and external factors could influence price movements.
Confidence Level
Potential Risks
The potential for a market correction or negative news could derail the upward trend, leading to unexpected declines.
3 Months Prediction
Target: July 13, 2025$36
$35
$37
$33
Description
If the stock maintains its upward trajectory, it could reach new highs, driven by positive earnings and market recovery. However, macroeconomic factors and potential market corrections pose risks.
Analysis
The stock has shown a bearish trend recently, with significant support at 29.1. The RSI is improving, indicating a potential reversal. However, the MACD remains bearish, and volume spikes suggest uncertainty. The market sentiment is mixed, influenced by broader economic conditions.
Confidence Level
Potential Risks
Long-term predictions are inherently uncertain; economic downturns or negative news could significantly impact the stock's performance.