SIF Trading Predictions
1 Day Prediction
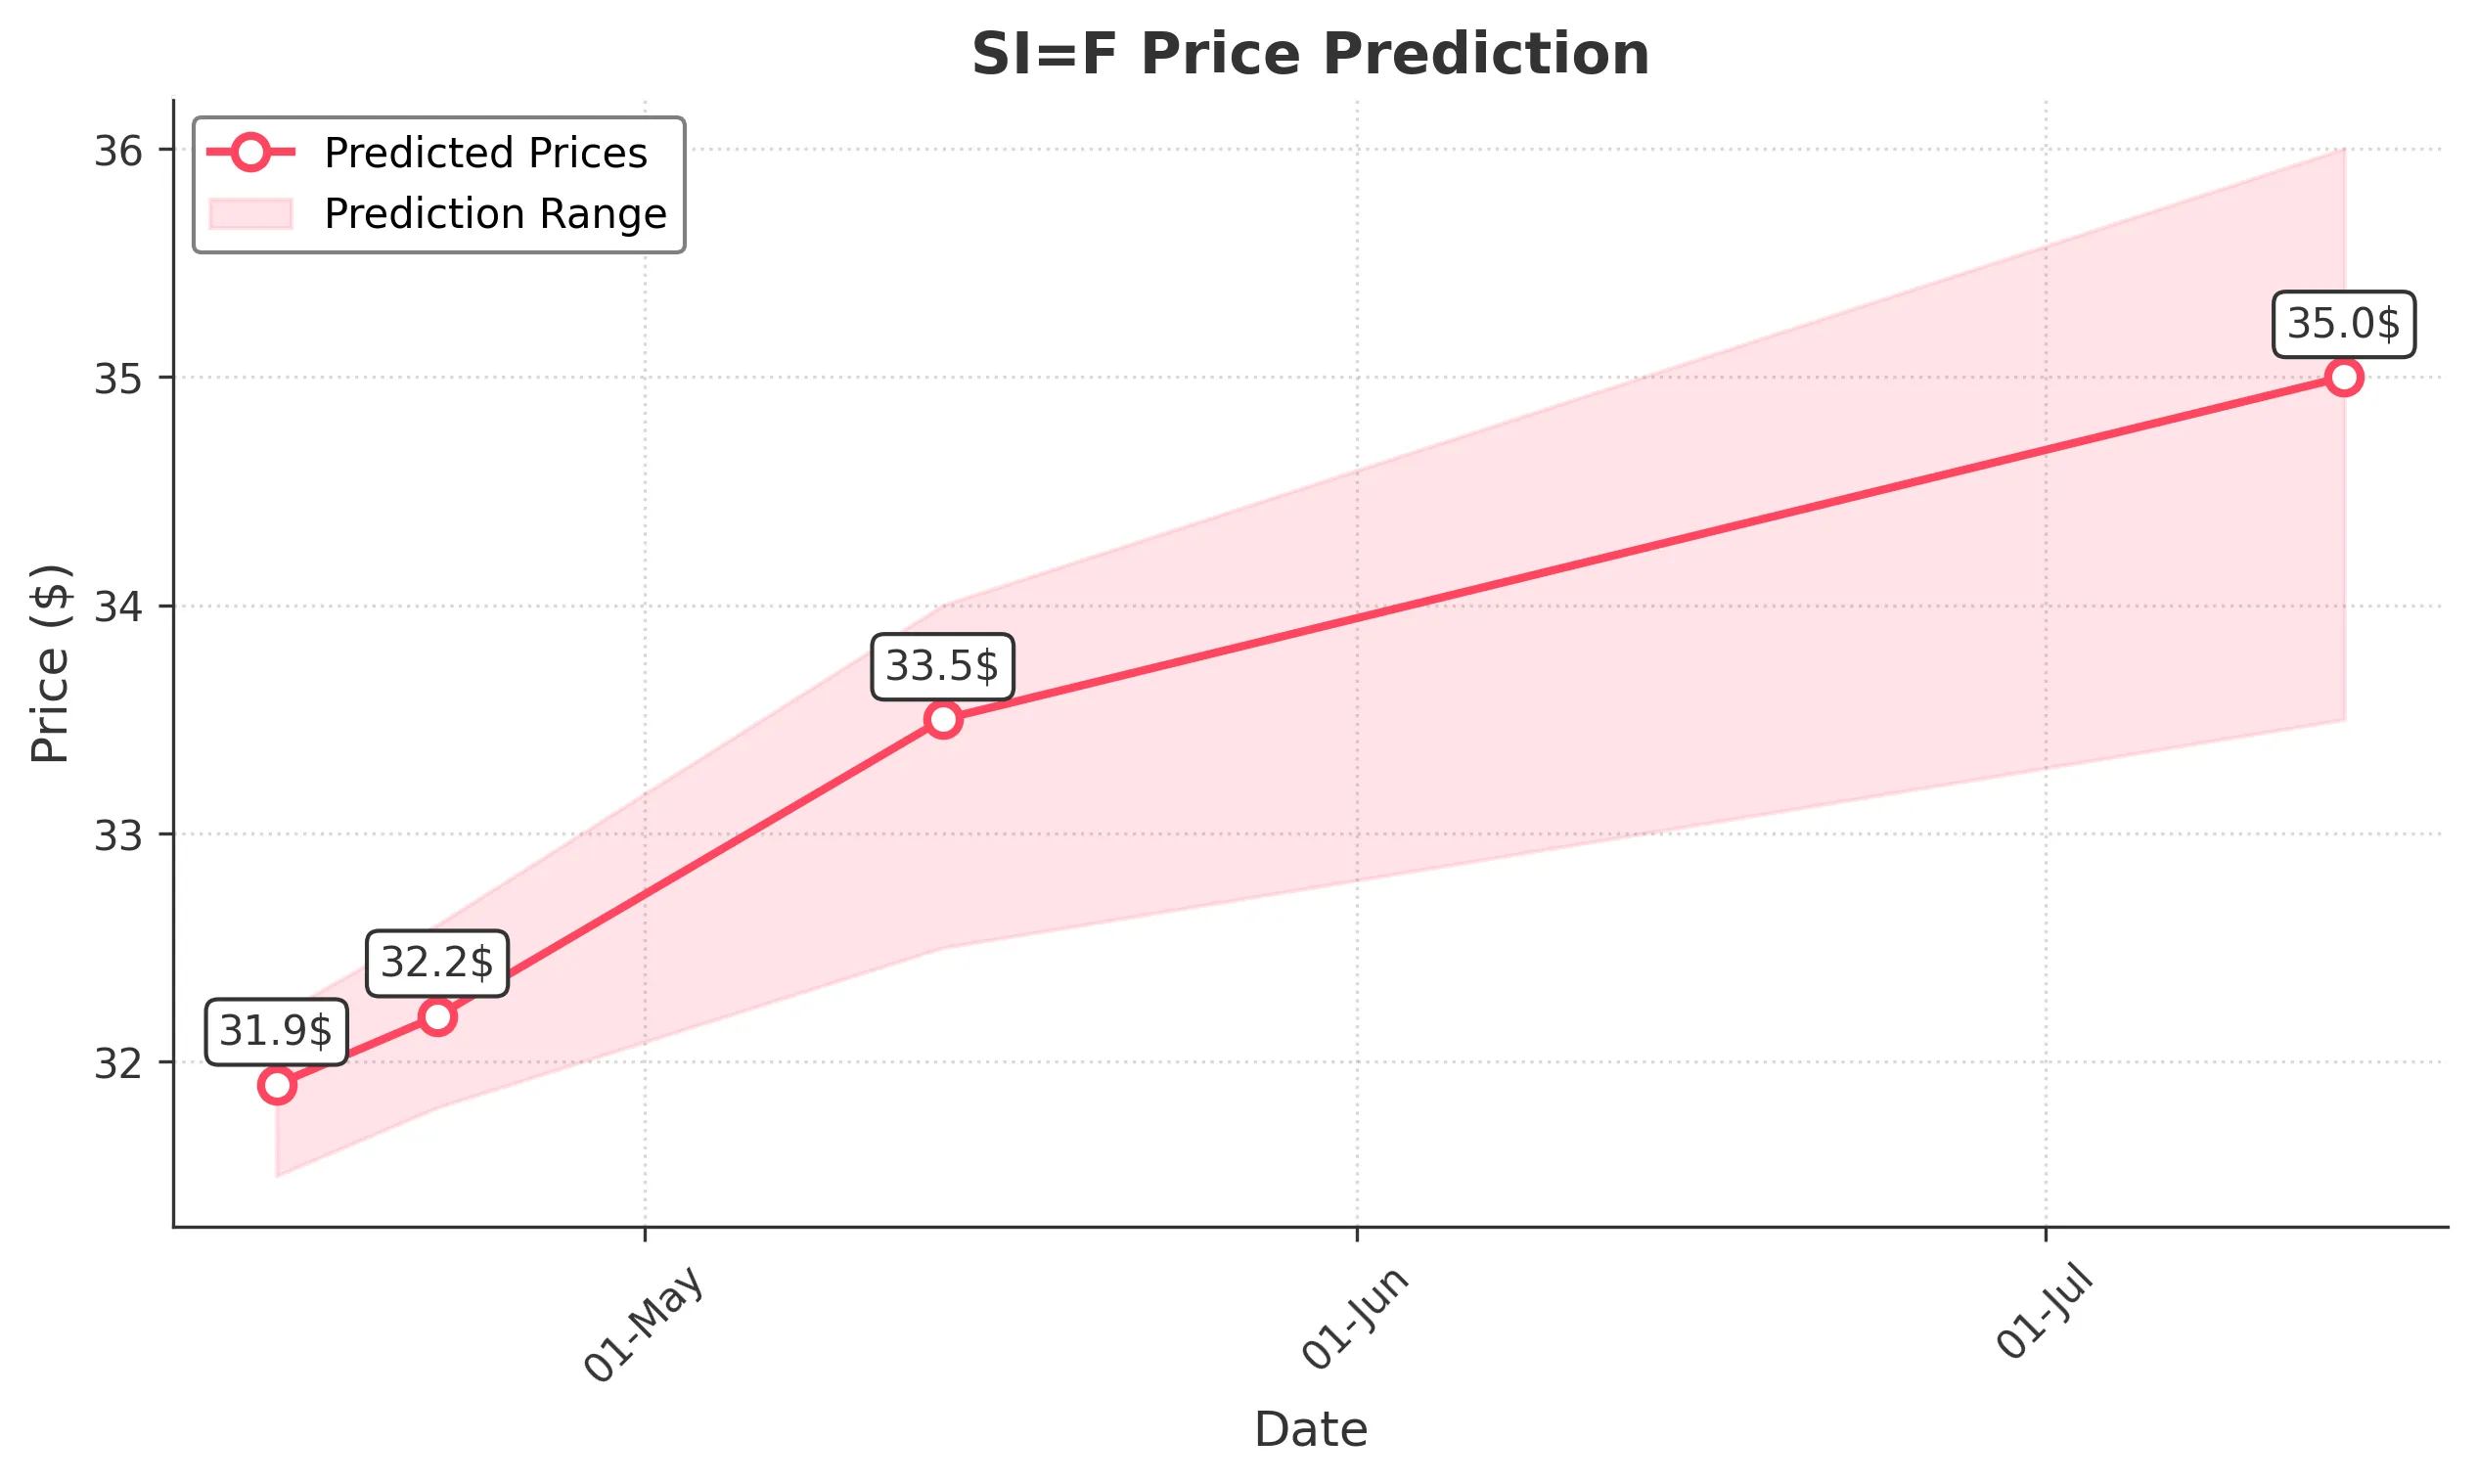
Target: April 15, 2025$31.9
$31.85
$32.2
$31.5
Description
The stock shows a slight bullish trend with a recent Doji pattern indicating indecision. RSI is neutral, and MACD is close to crossing above the signal line, suggesting potential upward momentum. However, recent volatility may lead to fluctuations.
Analysis
Over the past 3 months, SI=F has shown a bearish trend recently, with significant support around 29.00. The stock has experienced high volatility, especially after recent highs. Volume spikes indicate potential interest, but the overall trend remains cautious.
Confidence Level
Potential Risks
Market sentiment could shift due to external news or earnings reports, which may impact the stock's performance.
1 Week Prediction
Target: April 22, 2025$32.2
$32
$32.6
$31.8
Description
The stock may recover slightly as it approaches a Fibonacci retracement level. The recent bullish engulfing pattern suggests a potential reversal. However, the RSI indicates overbought conditions, which could limit upside.
Analysis
The stock has been volatile, with a recent bearish phase. Key support at 29.00 and resistance at 34.00 are critical. The MACD shows divergence, indicating potential reversal, but caution is warranted due to market sentiment.
Confidence Level
Potential Risks
Potential resistance at 32.50 could hinder upward movement, and any negative news could reverse the trend.
1 Month Prediction
Target: May 14, 2025$33.5
$32.8
$34
$32.5
Description
A bullish trend may develop as the stock approaches key support levels. The MACD is showing signs of a bullish crossover, and the RSI is stabilizing. However, market volatility remains a concern.
Analysis
The stock has fluctuated significantly, with a recent bearish trend. Key support at 29.00 and resistance at 34.00 are critical. The overall sentiment is mixed, with potential for recovery but also risks of further declines.
Confidence Level
Potential Risks
Unforeseen macroeconomic events could impact the stock's trajectory, and resistance levels may pose challenges.
3 Months Prediction
Target: July 14, 2025$35
$34.5
$36
$33.5
Description
If the bullish trend continues, the stock could reach higher levels. The MACD indicates potential upward momentum, and the RSI may stabilize. However, external factors could lead to volatility.
Analysis
The stock has shown mixed performance, with recent bearish trends. Key support at 29.00 and resistance at 34.00 are crucial. The overall market sentiment is uncertain, with potential for both upward and downward movements.
Confidence Level
Potential Risks
Market conditions and economic indicators could significantly affect the stock's performance, leading to unexpected downturns.