SIF Trading Predictions
1 Day Prediction
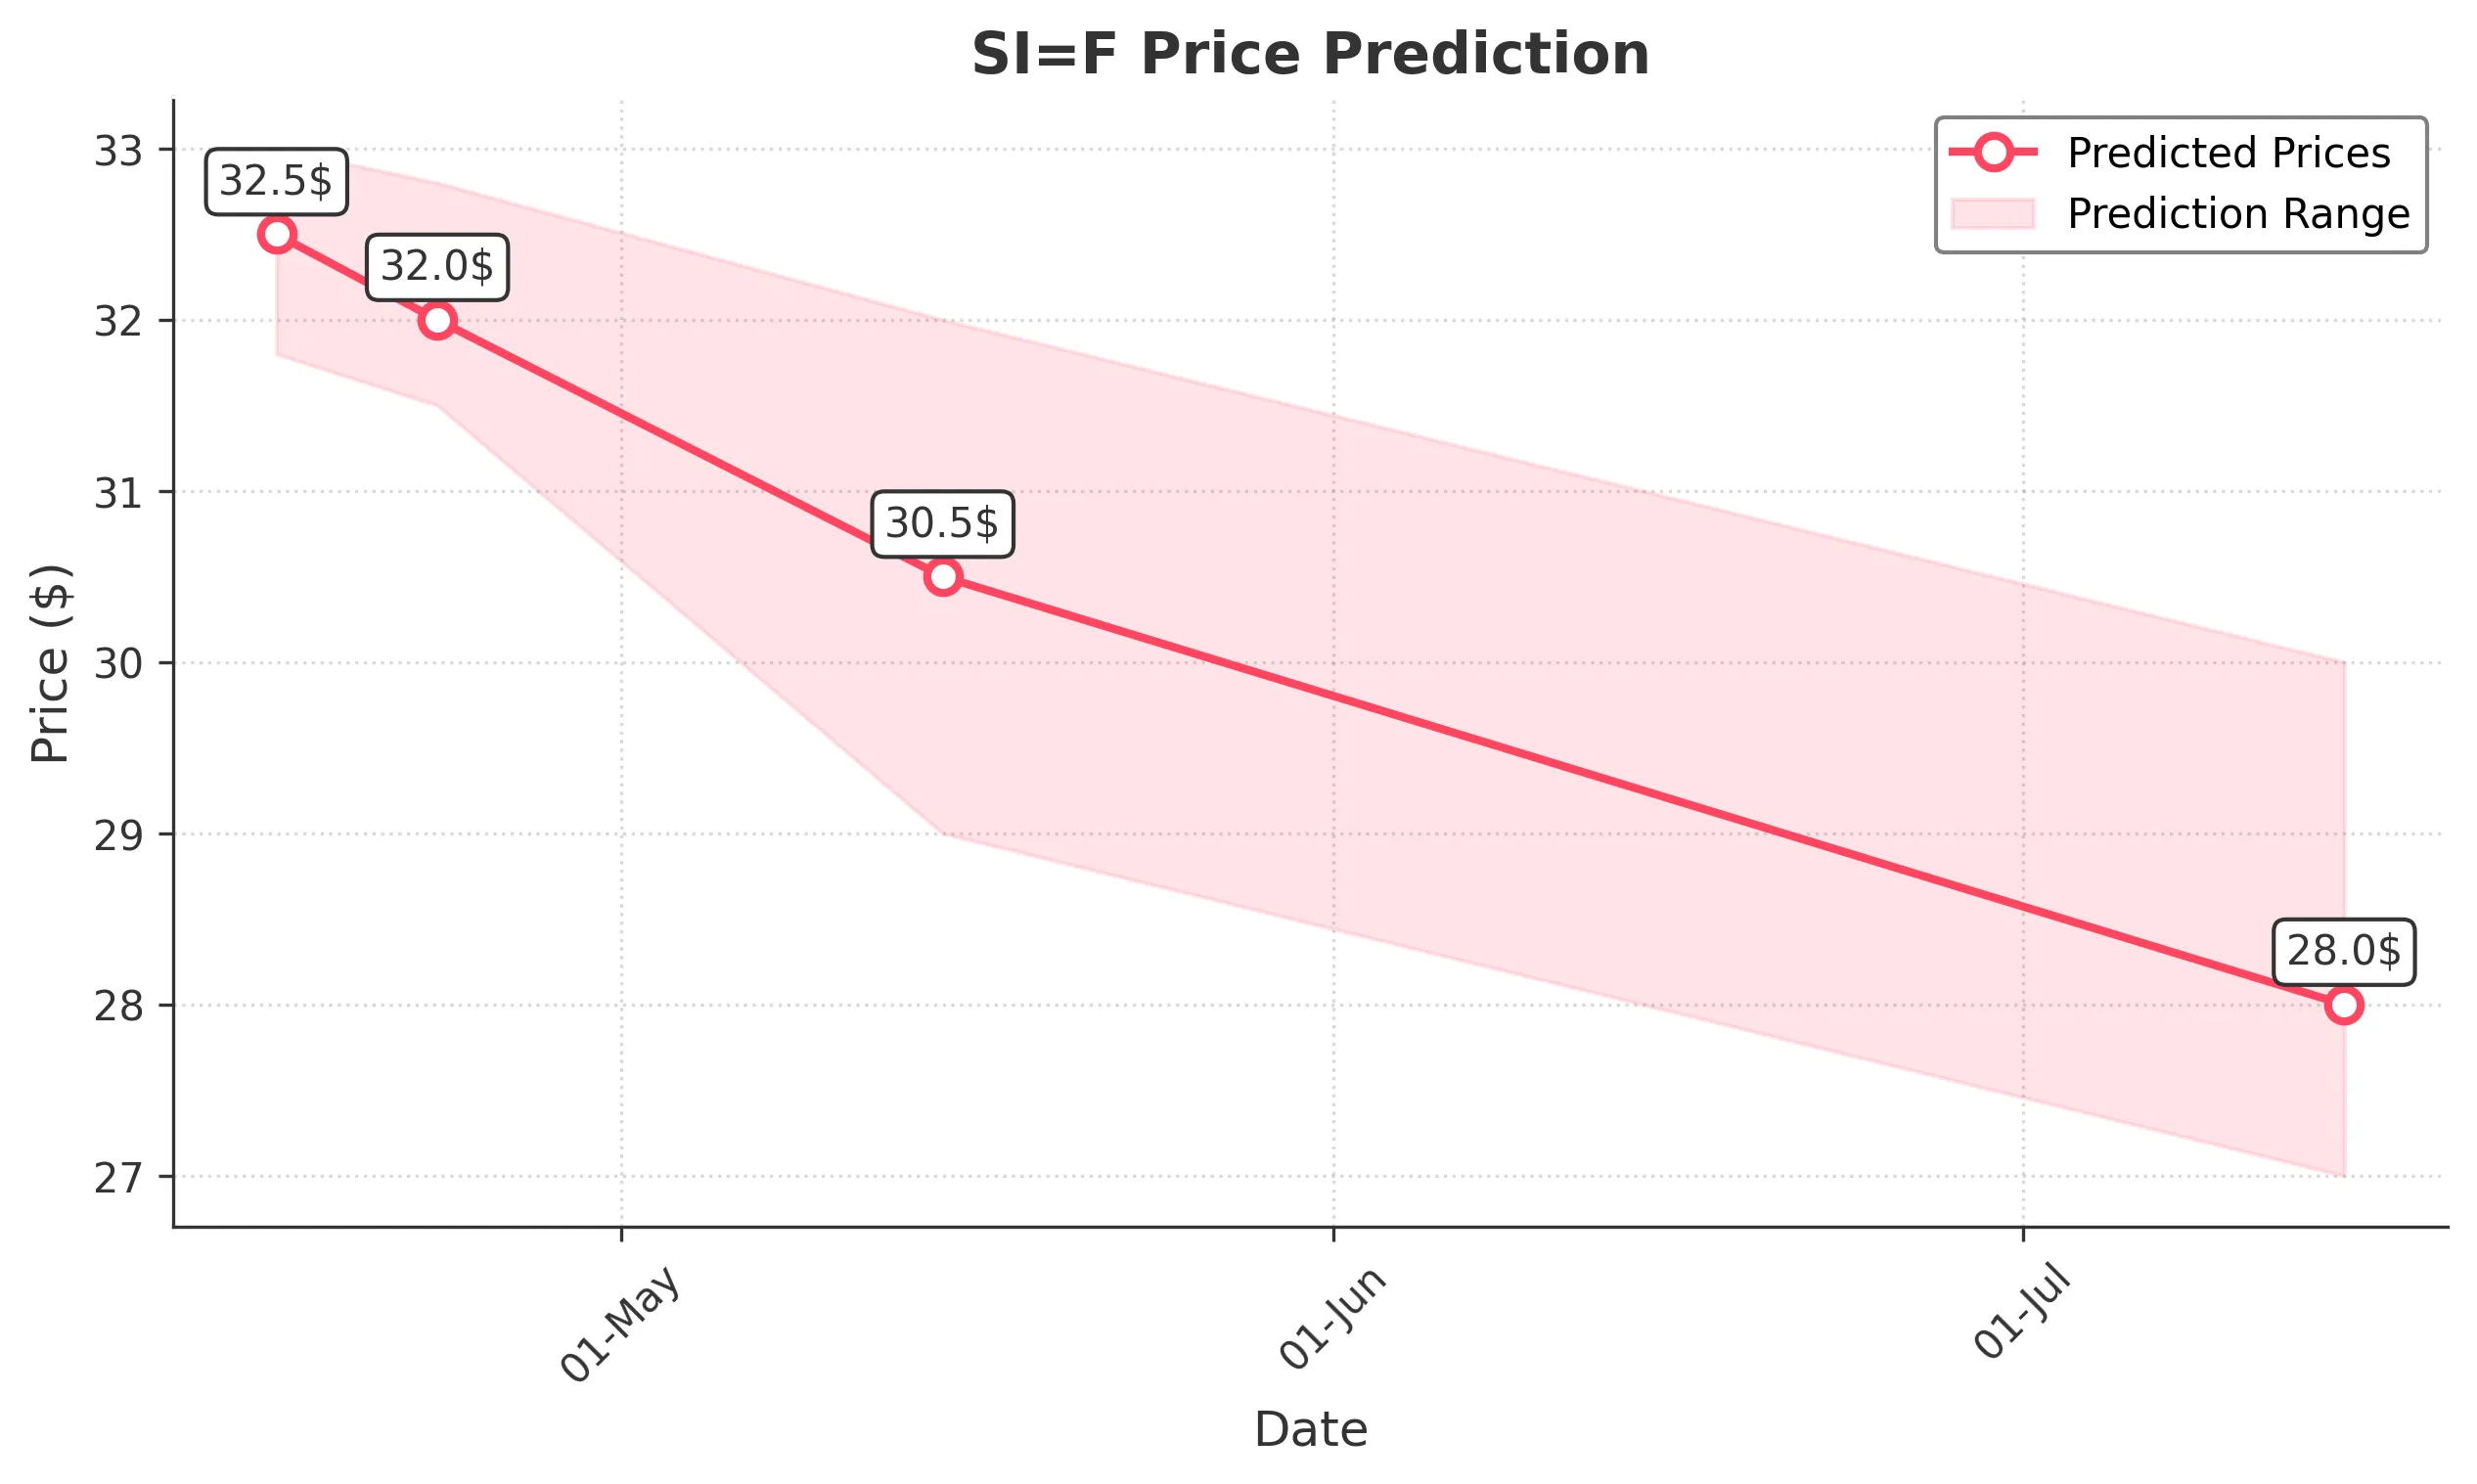
Target: April 16, 2025$32.5
$32.3
$33
$31.8
Description
The stock shows a slight bullish trend with a recent upward movement. The RSI is near 60, indicating potential for further gains. However, recent volatility suggests caution. A Doji pattern indicates indecision, which could lead to a pullback.
Analysis
Over the past 3 months, SI=F has shown a bullish trend with significant resistance around 34.5. Recent price action indicates volatility, with support at 29.1. The MACD is bullish, but volume spikes suggest potential reversals.
Confidence Level
Potential Risks
Market sentiment could shift due to external news or earnings reports, impacting the prediction.
1 Week Prediction
Target: April 23, 2025$32
$32.5
$32.8
$31.5
Description
The stock may consolidate around current levels. The Bollinger Bands are tightening, indicating reduced volatility. A bearish engulfing pattern suggests potential downward pressure, but support at 31.5 may hold.
Analysis
The stock has been fluctuating between 29 and 34, with recent bearish signals. The ATR indicates increasing volatility, and the RSI is approaching overbought levels, suggesting a potential pullback.
Confidence Level
Potential Risks
Unforeseen market events or earnings could lead to unexpected price movements.
1 Month Prediction
Target: May 15, 2025$30.5
$31
$32
$29
Description
Expect a bearish trend as the stock may retest lower support levels. The MACD shows a bearish crossover, and the RSI is declining. Recent price action indicates a potential downtrend, with resistance at 32.5.
Analysis
The stock has been in a bearish phase recently, with significant resistance at 34.5. Volume analysis shows increased selling pressure, and the recent candlestick patterns suggest a potential continuation of the downtrend.
Confidence Level
Potential Risks
Economic indicators or changes in market sentiment could alter this outlook.
3 Months Prediction
Target: July 15, 2025$28
$29
$30
$27
Description
The stock is likely to continue its bearish trend, with potential for further declines. The Fibonacci retracement levels indicate strong resistance at 30.5, and the overall market sentiment is cautious.
Analysis
Over the past 3 months, SI=F has shown a bearish trend with key support at 28. The MACD is bearish, and the RSI indicates oversold conditions. Volume patterns suggest increased selling pressure, warranting caution.
Confidence Level
Potential Risks
Macroeconomic factors or unexpected news could significantly impact the stock's performance.