SIF Trading Predictions
1 Day Prediction
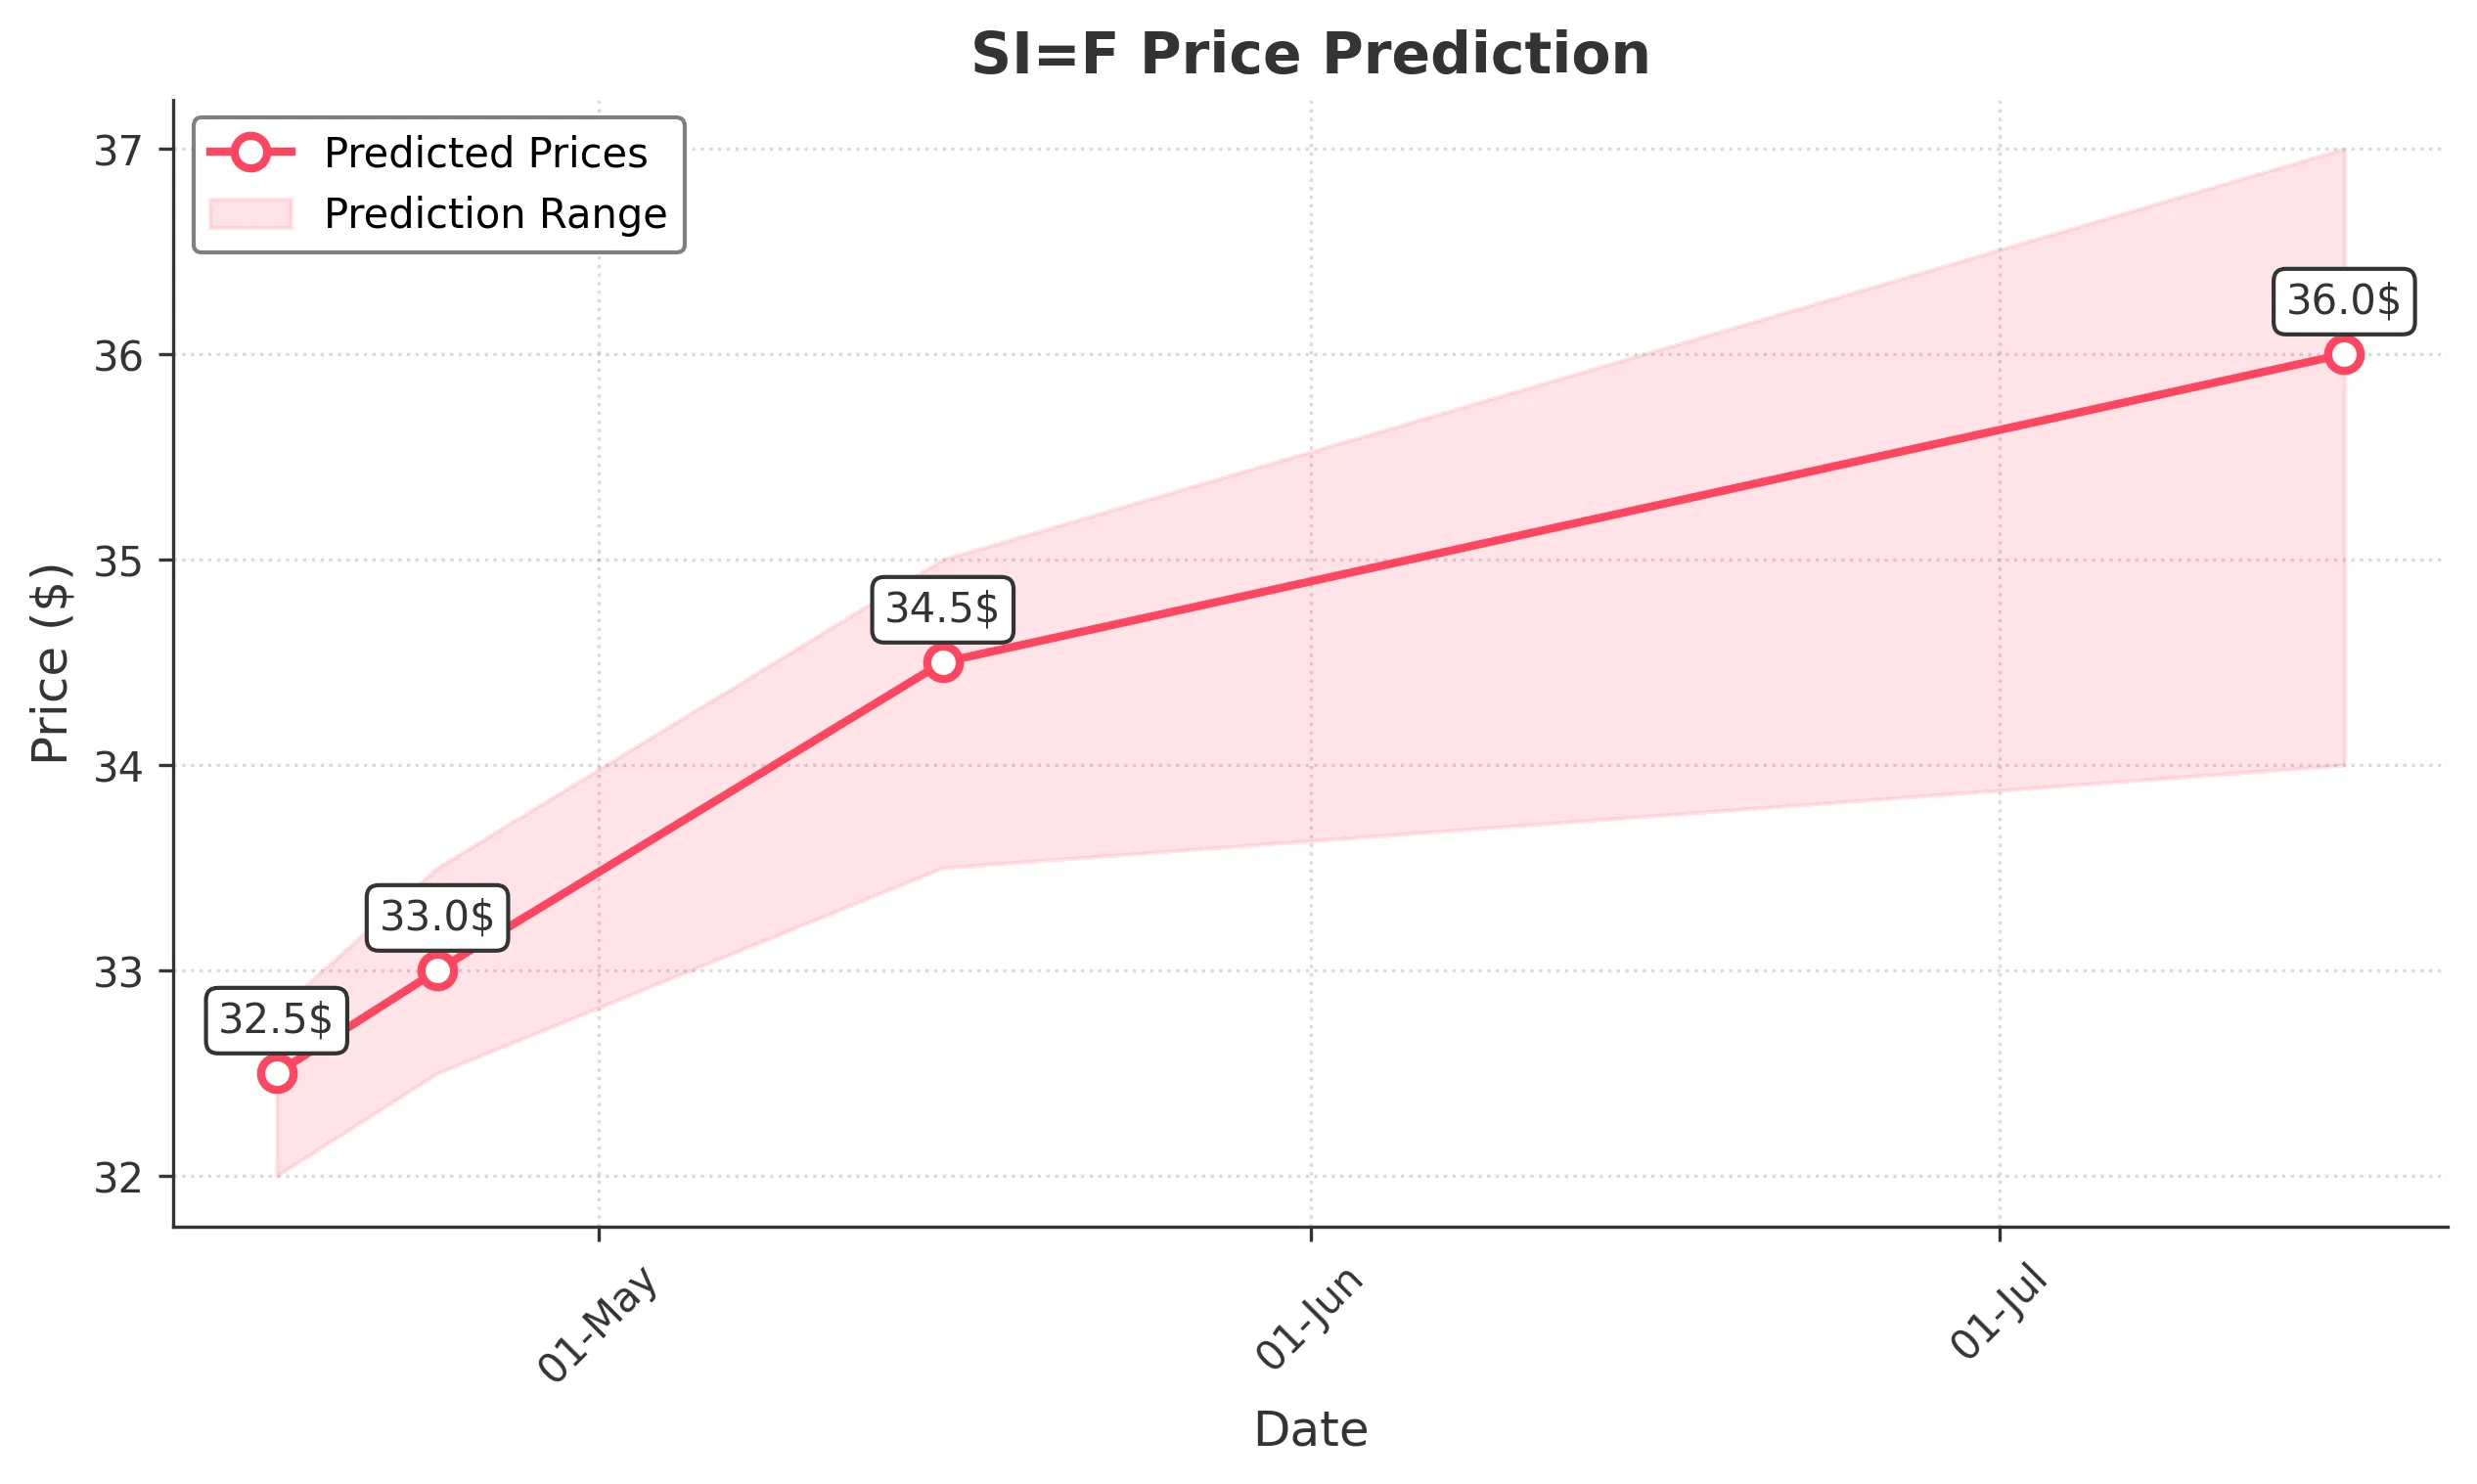
Target: April 17, 2025$32.5
$32.4
$32.8
$32
Description
The stock shows a slight bullish trend with a recent upward movement. The RSI is neutral, indicating no overbought conditions. A potential Doji pattern suggests indecision, but overall sentiment remains cautiously optimistic.
Analysis
Over the past 3 months, SI=F has shown a bearish trend recently, with significant support around 29.0. The recent recovery from lows indicates potential bullish momentum, but the overall market sentiment remains cautious due to macroeconomic factors.
Confidence Level
Potential Risks
Market volatility and external news could impact the price unexpectedly.
1 Week Prediction
Target: April 24, 2025$33
$32.8
$33.5
$32.5
Description
A bullish reversal pattern is forming, supported by a rising MACD. The stock is approaching a Fibonacci retracement level, suggesting potential upward movement. However, volume remains low, indicating caution.
Analysis
The stock has experienced fluctuations, with resistance at 34.0 and support at 29.0. The recent price action shows a potential recovery, but external economic factors could hinder sustained growth.
Confidence Level
Potential Risks
Low trading volume may lead to price manipulation or sudden reversals.
1 Month Prediction
Target: May 16, 2025$34.5
$33.8
$35
$33.5
Description
The stock is expected to continue its upward trend, supported by bullish candlestick patterns and a positive MACD crossover. The RSI indicates room for growth, but caution is advised due to potential market corrections.
Analysis
SI=F has shown resilience with a recent upward trend. Key resistance levels are at 35.0, while support remains at 29.0. The overall sentiment is cautiously optimistic, but external factors could impact performance.
Confidence Level
Potential Risks
Economic indicators and earnings reports could introduce volatility.
3 Months Prediction
Target: July 16, 2025$36
$35
$37
$34
Description
Long-term indicators suggest a bullish trend, with the stock breaking through key resistance levels. The MACD and RSI indicate strong momentum, but market sentiment could shift based on macroeconomic developments.
Analysis
The stock has shown a recovery from recent lows, with a bullish outlook supported by technical indicators. Key resistance at 37.0 and support at 29.0 suggest potential for growth, but external factors must be monitored.
Confidence Level
Potential Risks
Unforeseen economic events or changes in market sentiment could lead to volatility.