SIF Trading Predictions
1 Day Prediction
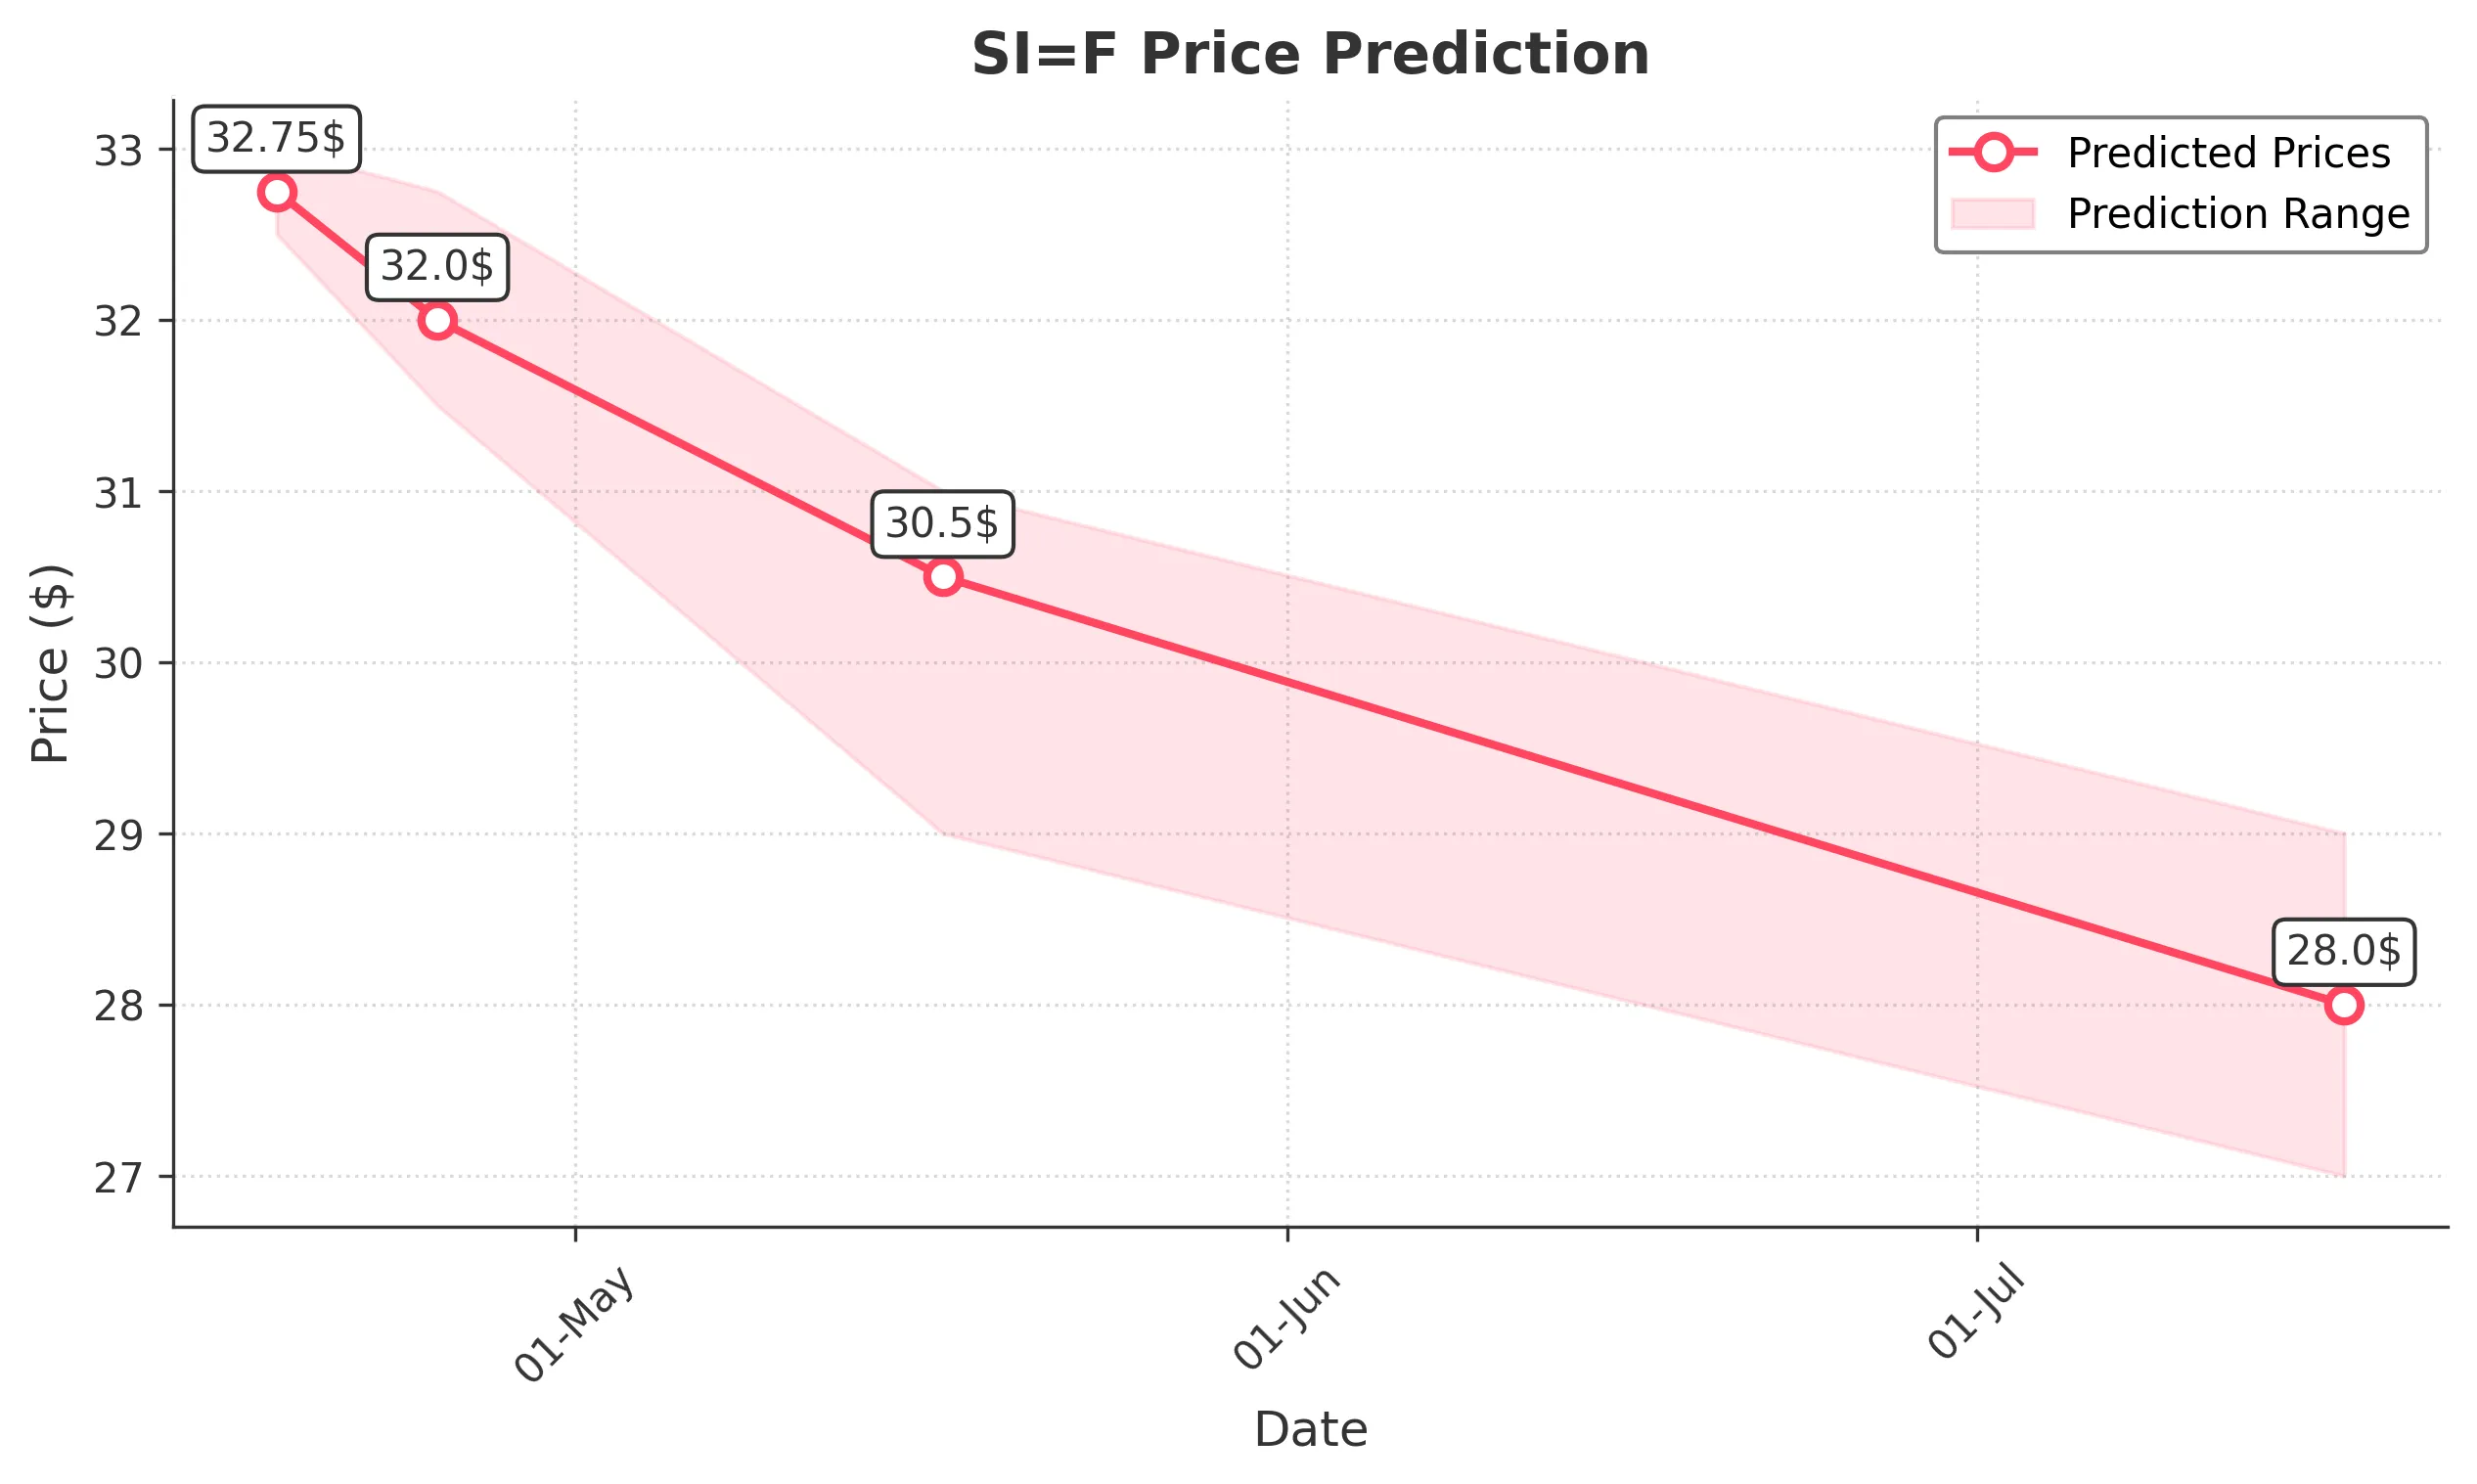
Target: April 18, 2025$32.75
$32.6
$33
$32.5
Description
The stock shows a slight bullish trend with a recent close above the 50-day moving average. RSI indicates overbought conditions, suggesting a potential pullback. Volume is expected to increase as traders react to recent price movements.
Analysis
Over the past 3 months, SI=F has shown a bullish trend with significant support at 32.00 and resistance around 34.00. Recent candlestick patterns indicate indecision, and volume spikes suggest increased interest. However, macroeconomic factors may introduce volatility.
Confidence Level
Potential Risks
Potential for a reversal exists due to overbought RSI and recent volatility.
1 Week Prediction
Target: April 25, 2025$32
$32.5
$32.75
$31.5
Description
Expect a slight decline as the stock approaches resistance levels. The MACD shows bearish divergence, and the RSI is trending downwards, indicating potential selling pressure. Volume may decrease as traders take profits.
Analysis
The stock has been consolidating around the 32.00 level, with resistance at 34.00. Recent bearish candlestick patterns suggest a potential pullback. Volume analysis indicates a decrease in buying interest, which could lead to further declines.
Confidence Level
Potential Risks
Market sentiment could shift rapidly due to external news or earnings reports, impacting the prediction.
1 Month Prediction
Target: May 17, 2025$30.5
$31
$31
$29
Description
A bearish outlook is anticipated as the stock may test lower support levels. The 200-day moving average is approaching, and bearish patterns are forming. Volume may increase as traders react to potential breakdowns.
Analysis
The stock has shown signs of weakness, with key support at 30.00. Technical indicators suggest a bearish trend, and recent volume spikes indicate selling pressure. Market sentiment is cautious, and external factors could lead to increased volatility.
Confidence Level
Potential Risks
Unforeseen macroeconomic events or earnings surprises could significantly alter the stock's trajectory.
3 Months Prediction
Target: July 17, 2025$28
$29
$29
$27
Description
Long-term bearish sentiment is expected as the stock may continue to decline towards historical support levels. The overall market trend and economic conditions will play a significant role in this prediction.
Analysis
The stock has been in a downtrend, with significant resistance at 30.00. Technical indicators suggest further declines, and volume patterns indicate a lack of buying interest. Macroeconomic factors and market sentiment will be crucial in determining future performance.
Confidence Level
Potential Risks
Market conditions can change rapidly, and any positive news could reverse the trend.