SIF Trading Predictions
1 Day Prediction
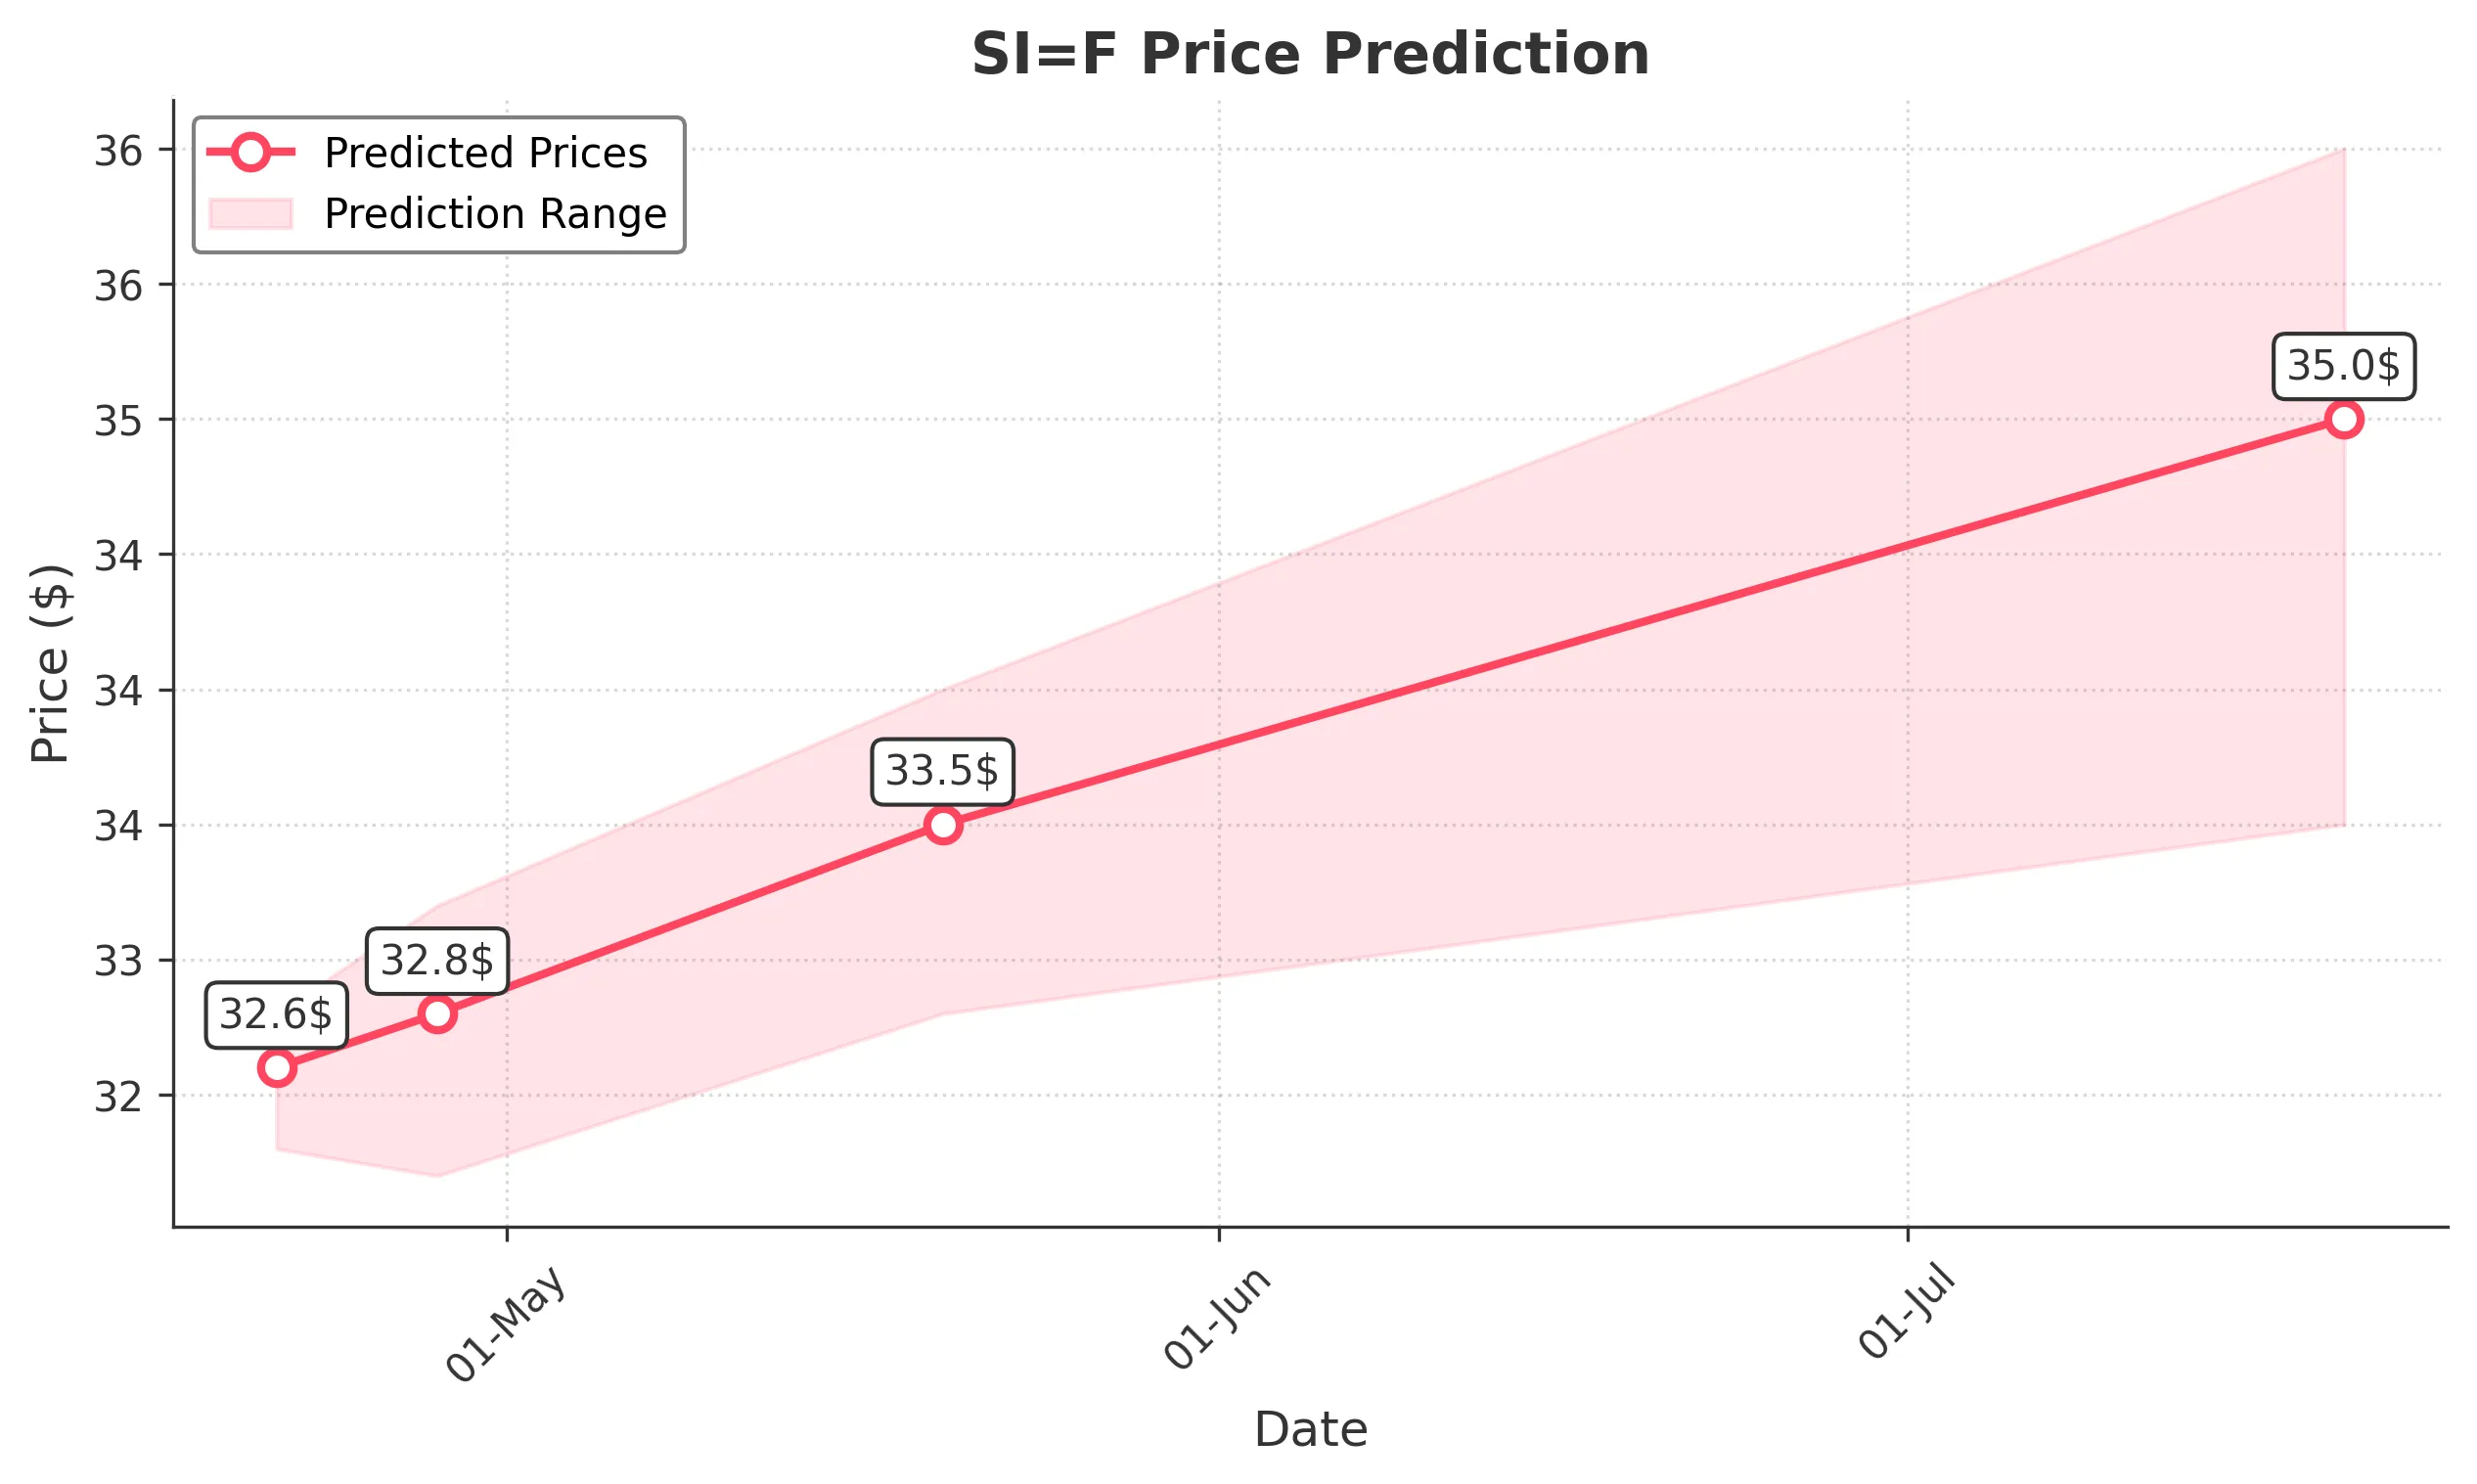
Target: April 21, 2025$32.6
$32.5
$32.8
$32.3
Description
The stock shows a slight bullish trend with a recent close above the 20-day moving average. RSI indicates neutrality, while MACD is close to crossing above the signal line. Expect minor fluctuations due to low volume.
Analysis
Over the past 3 months, SI=F has shown a bearish trend recently, with significant support around 30. The stock has experienced high volatility, especially in early April. The recent price action suggests a potential recovery, but external factors could influence this.
Confidence Level
Potential Risks
Potential for volatility due to low trading volume and market sentiment shifts.
1 Week Prediction
Target: April 28, 2025$32.8
$32.6
$33.2
$32.2
Description
The stock is expected to stabilize as it approaches resistance at 33. The MACD shows a bullish divergence, and the RSI is recovering from oversold conditions. Volume is expected to increase slightly as traders react to price movements.
Analysis
The stock has been in a bearish phase but shows signs of recovery. Key resistance at 33 could limit upward movement. Volume patterns indicate potential interest, but external market conditions remain a concern.
Confidence Level
Potential Risks
Market sentiment could shift quickly, impacting the stock's ability to break resistance levels.
1 Month Prediction
Target: May 20, 2025$33.5
$32.9
$34
$32.8
Description
A gradual recovery is anticipated as the stock approaches key Fibonacci retracement levels. The MACD is bullish, and RSI is trending upwards, indicating increasing buying pressure. Volume is expected to rise as sentiment improves.
Analysis
The stock has shown resilience despite recent declines. Key support at 30 has held, and the potential for a bullish reversal exists. Technical indicators suggest a positive outlook, but macroeconomic factors could pose risks.
Confidence Level
Potential Risks
Economic indicators and earnings reports could introduce volatility, affecting the stock's trajectory.
3 Months Prediction
Target: July 20, 2025$35
$34
$36
$33.5
Description
Long-term bullish sentiment is expected as the stock breaks through resistance levels. The MACD and RSI indicate strong upward momentum. Anticipated volume increases as more investors enter the market, driven by positive sentiment.
Analysis
The stock has shown a mixed performance over the past three months, with significant volatility. However, recent price action suggests a potential bullish trend. Key resistance levels will be critical in determining future price movements.
Confidence Level
Potential Risks
Unforeseen market events or economic downturns could derail the bullish trend.