SIF Trading Predictions
1 Day Prediction
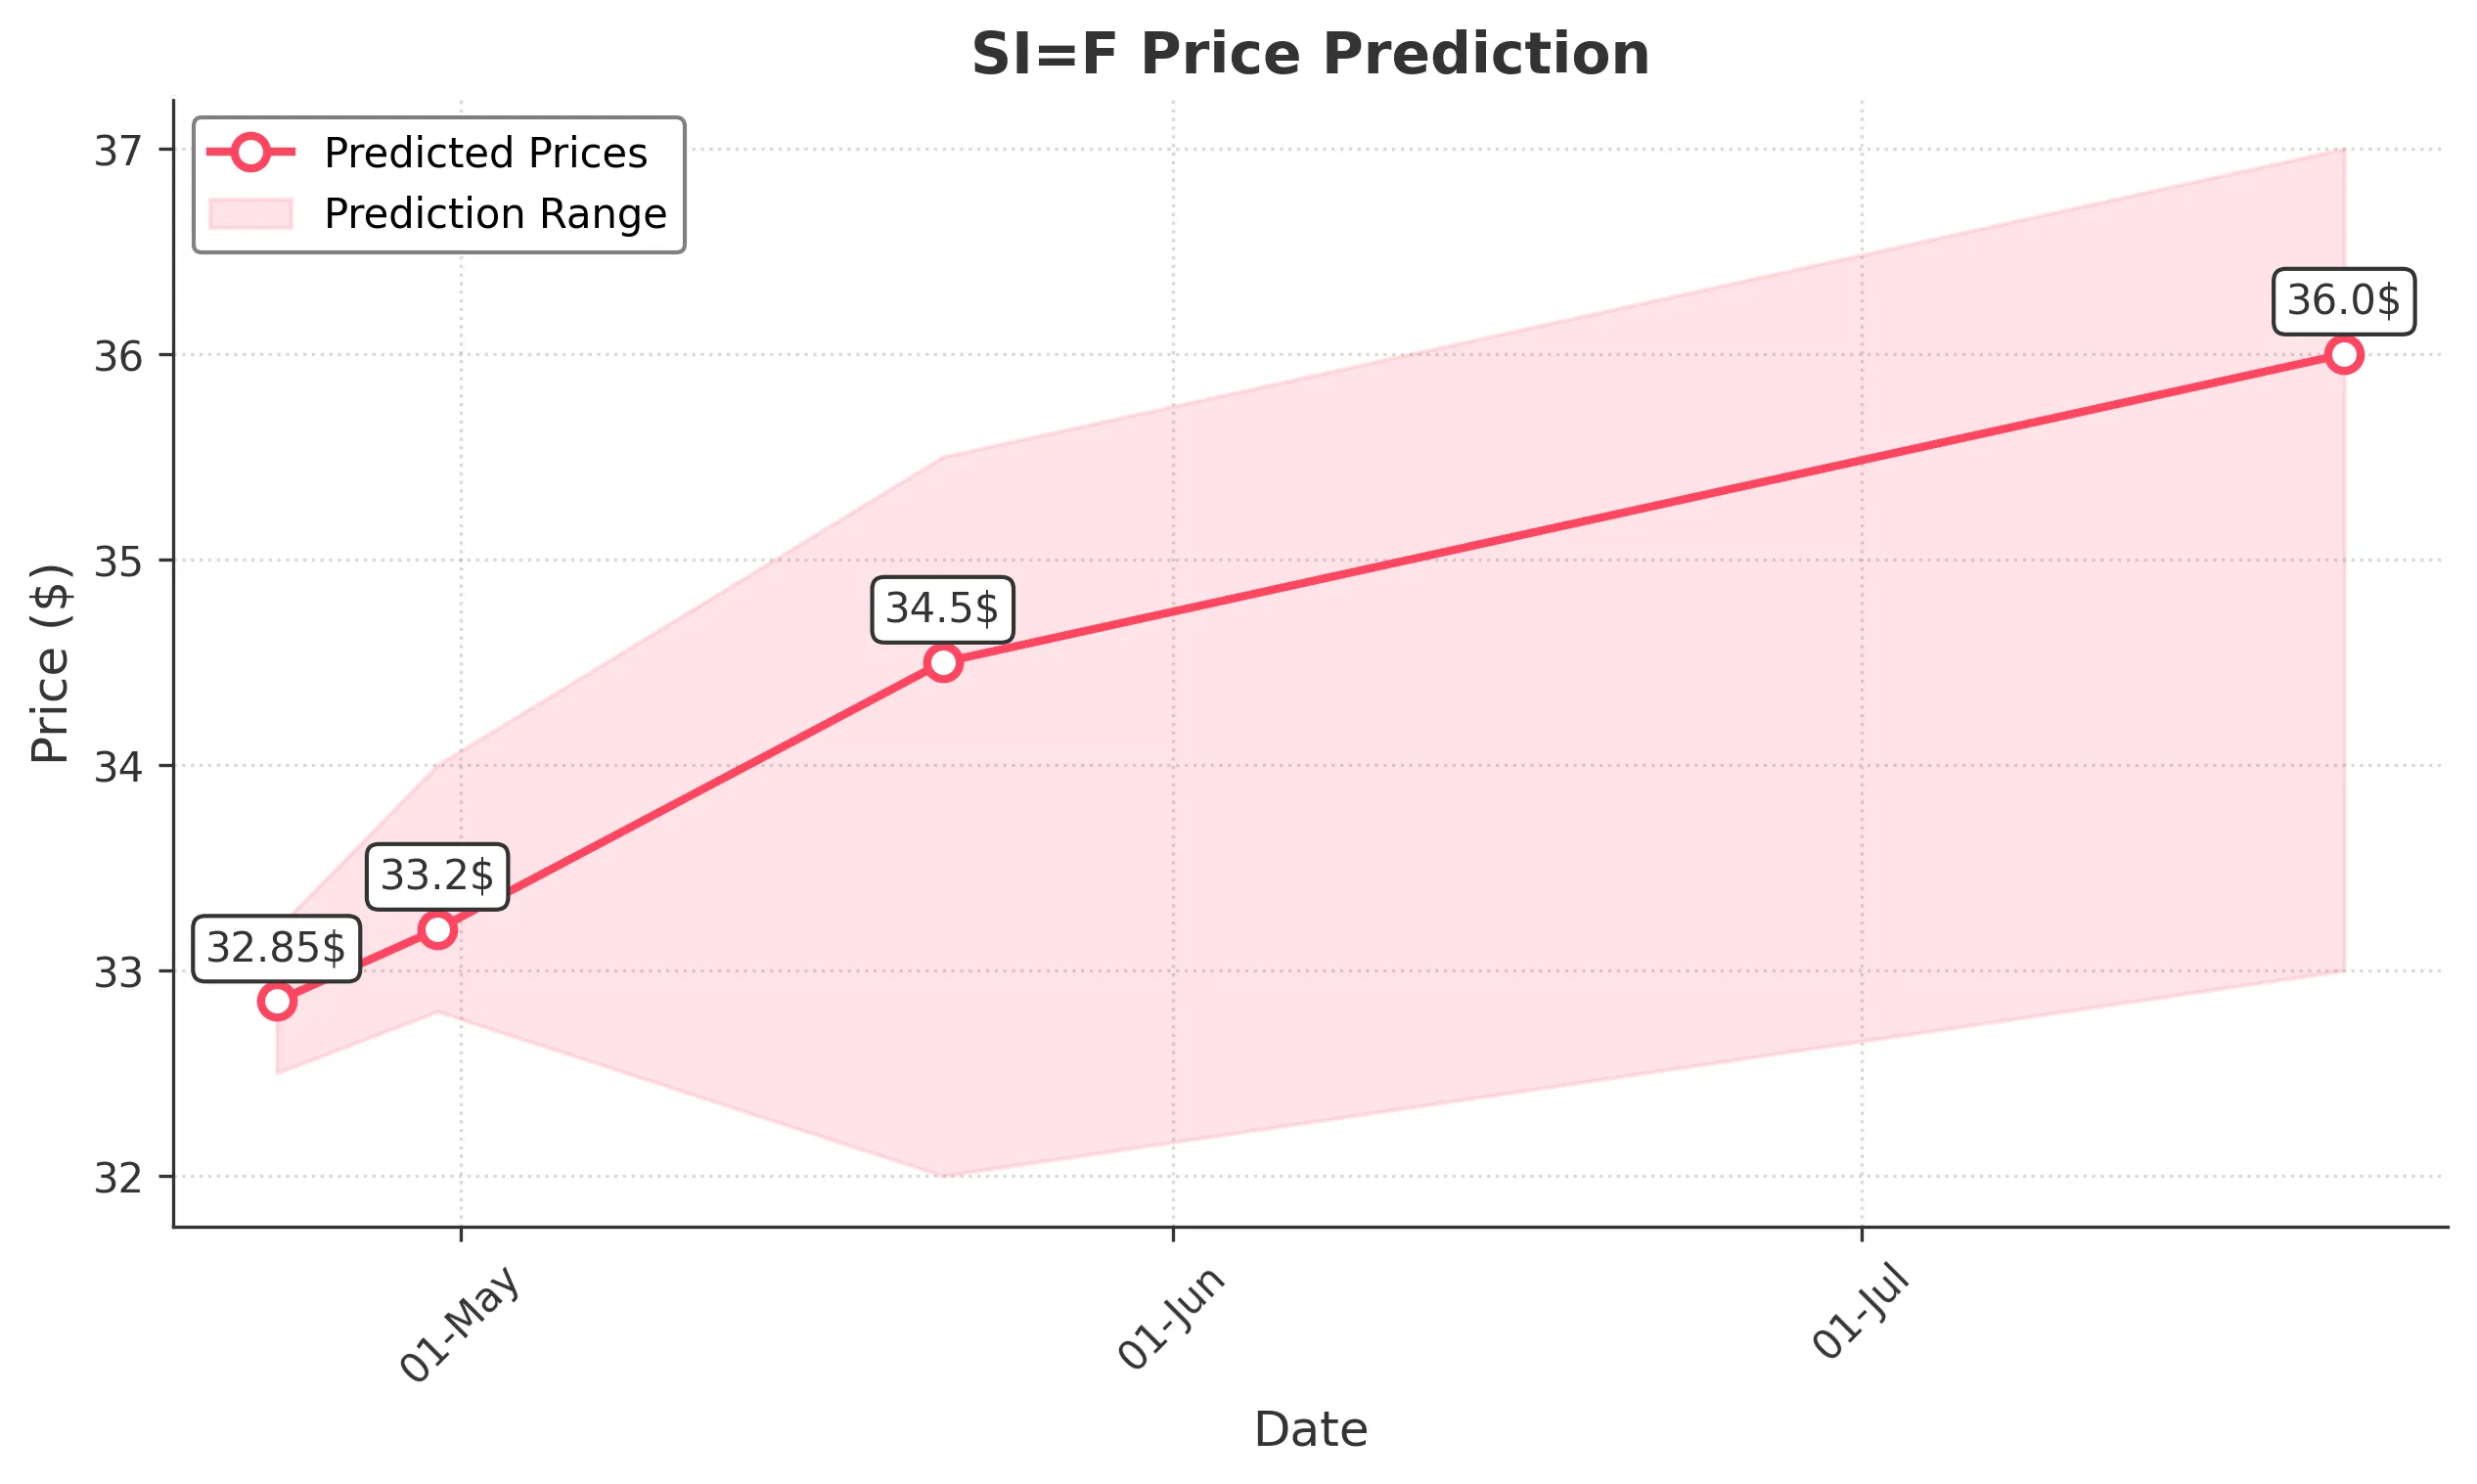
Target: April 23, 2025$32.85
$32.8
$33.2
$32.5
Description
The stock shows a slight bullish trend with a recent close above the 50-day moving average. RSI indicates neutrality, while MACD is showing a potential bullish crossover. However, recent volatility suggests caution.
Analysis
Over the past 3 months, SI=F has shown a mix of bullish and bearish trends, with significant resistance around $34. Recent price action indicates a potential recovery from lows, but volatility remains high. Volume spikes on certain days suggest investor interest.
Confidence Level
Potential Risks
Market sentiment could shift due to external news or earnings reports, which may impact the stock's performance.
1 Week Prediction
Target: April 30, 2025$33.2
$32.9
$34
$32.8
Description
The stock is expected to continue its upward momentum, supported by a bullish MACD and a recent bullish engulfing pattern. However, resistance at $34 may limit gains, and market sentiment remains mixed.
Analysis
The stock has been fluctuating around key support levels, with recent bullish patterns suggesting a possible upward trend. However, the overall market sentiment is cautious, and external factors could influence price movements.
Confidence Level
Potential Risks
Potential market corrections or negative news could reverse the trend, impacting the predicted price.
1 Month Prediction
Target: May 22, 2025$34.5
$33.5
$35.5
$32
Description
A bullish outlook is anticipated as the stock approaches key Fibonacci retracement levels. The RSI is nearing overbought territory, indicating potential for a pullback. Watch for volume spikes as confirmation.
Analysis
The stock has shown resilience, bouncing back from recent lows. Key resistance levels are being tested, and while bullish signals are present, the risk of a pullback remains due to overbought conditions.
Confidence Level
Potential Risks
Market volatility and economic indicators could lead to unexpected price movements, affecting the prediction.
3 Months Prediction
Target: July 22, 2025$36
$35
$37
$33
Description
Long-term bullish sentiment is supported by a strong upward trend and positive market sentiment. However, potential economic downturns could impact performance. Watch for key earnings reports.
Analysis
The stock has been on an upward trajectory, but external economic factors and market sentiment could introduce volatility. Key support levels are crucial for maintaining the bullish trend, while resistance at $37 may pose challenges.
Confidence Level
Potential Risks
Economic conditions and market sentiment could shift, leading to volatility and potential price corrections.