SIF Trading Predictions
1 Day Prediction
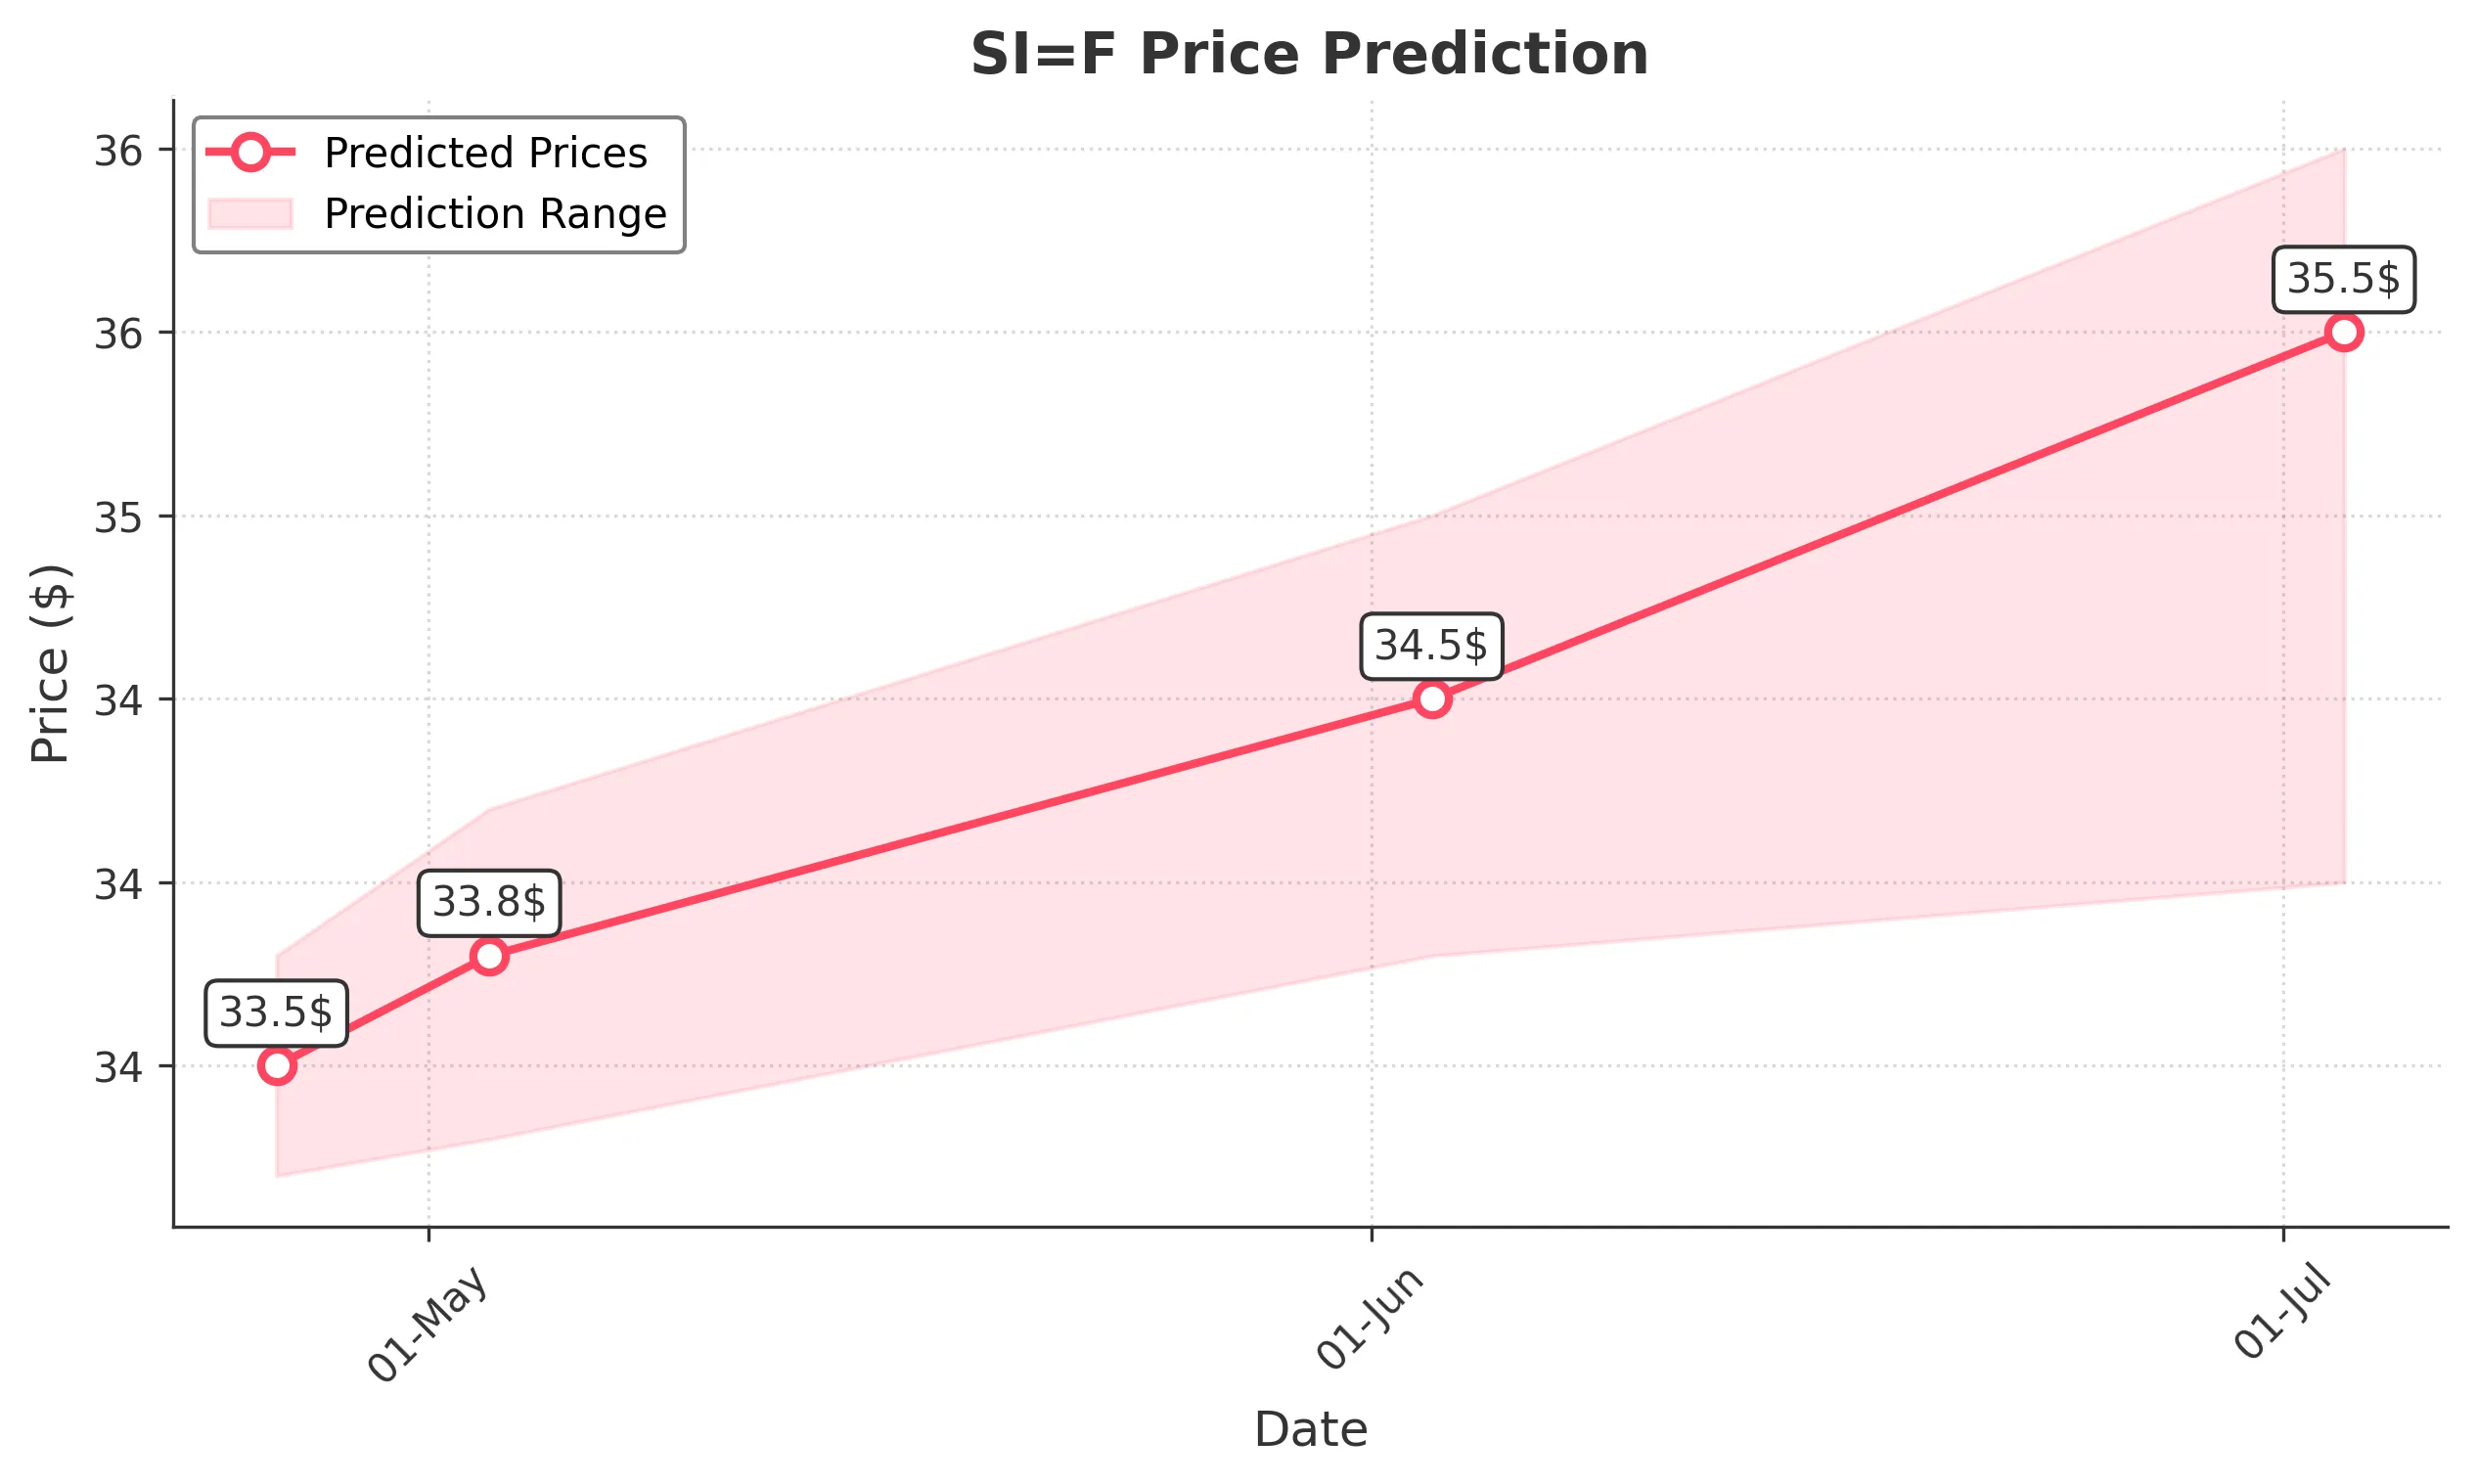
Target: April 26, 2025$33.5
$33.45
$33.8
$33.2
Description
The stock shows a slight bullish trend with recent higher lows. The RSI is approaching overbought levels, indicating potential resistance. Volume has been stable, suggesting steady interest. However, a bearish divergence in MACD could signal a pullback.
Analysis
Over the past 3 months, SI=F has shown a bullish trend with significant support around 32.00 and resistance near 34.00. The recent price action indicates a consolidation phase. Technical indicators like the MACD and RSI suggest caution, while volume patterns indicate steady interest.
Confidence Level
Potential Risks
Potential market volatility and external news could impact the price unexpectedly.
1 Week Prediction
Target: May 3, 2025$33.8
$33.6
$34.2
$33.3
Description
The stock is expected to maintain its upward momentum, supported by recent bullish candlestick patterns. However, the RSI indicates overbought conditions, which may lead to a short-term correction. Watch for volume spikes as a confirmation of trend strength.
Analysis
The stock has been in a bullish trend, with key support at 32.00 and resistance at 34.00. The recent price action shows a series of higher highs and higher lows. Technical indicators suggest a potential pullback, but overall sentiment remains positive.
Confidence Level
Potential Risks
Market sentiment can shift quickly, and any negative news could reverse the trend.
1 Month Prediction
Target: June 3, 2025$34.5
$34.2
$35
$33.8
Description
The stock is likely to continue its upward trajectory, supported by strong fundamentals and positive market sentiment. However, the RSI indicates potential overbought conditions, suggesting a possible correction before reaching new highs.
Analysis
SI=F has shown a strong bullish trend with significant support at 32.00. The MACD is bullish, and the RSI is nearing overbought territory. Volume has been consistent, indicating strong interest. However, caution is advised as the stock approaches resistance levels.
Confidence Level
Potential Risks
Economic indicators and geopolitical events could introduce volatility.
3 Months Prediction
Target: July 3, 2025$35.5
$35.2
$36
$34
Description
The stock is expected to reach new highs, driven by positive earnings reports and market sentiment. However, the potential for a market correction exists, especially if economic conditions change. Watch for volume trends to confirm the bullish outlook.
Analysis
The overall trend for SI=F remains bullish, with key support at 32.00 and resistance at 36.00. The stock has shown resilience, but the RSI indicates potential overbought conditions. Volume patterns suggest strong interest, but caution is warranted as the market evolves.
Confidence Level
Potential Risks
Unforeseen macroeconomic events could impact the stock's performance.