SIF Trading Predictions
1 Day Prediction
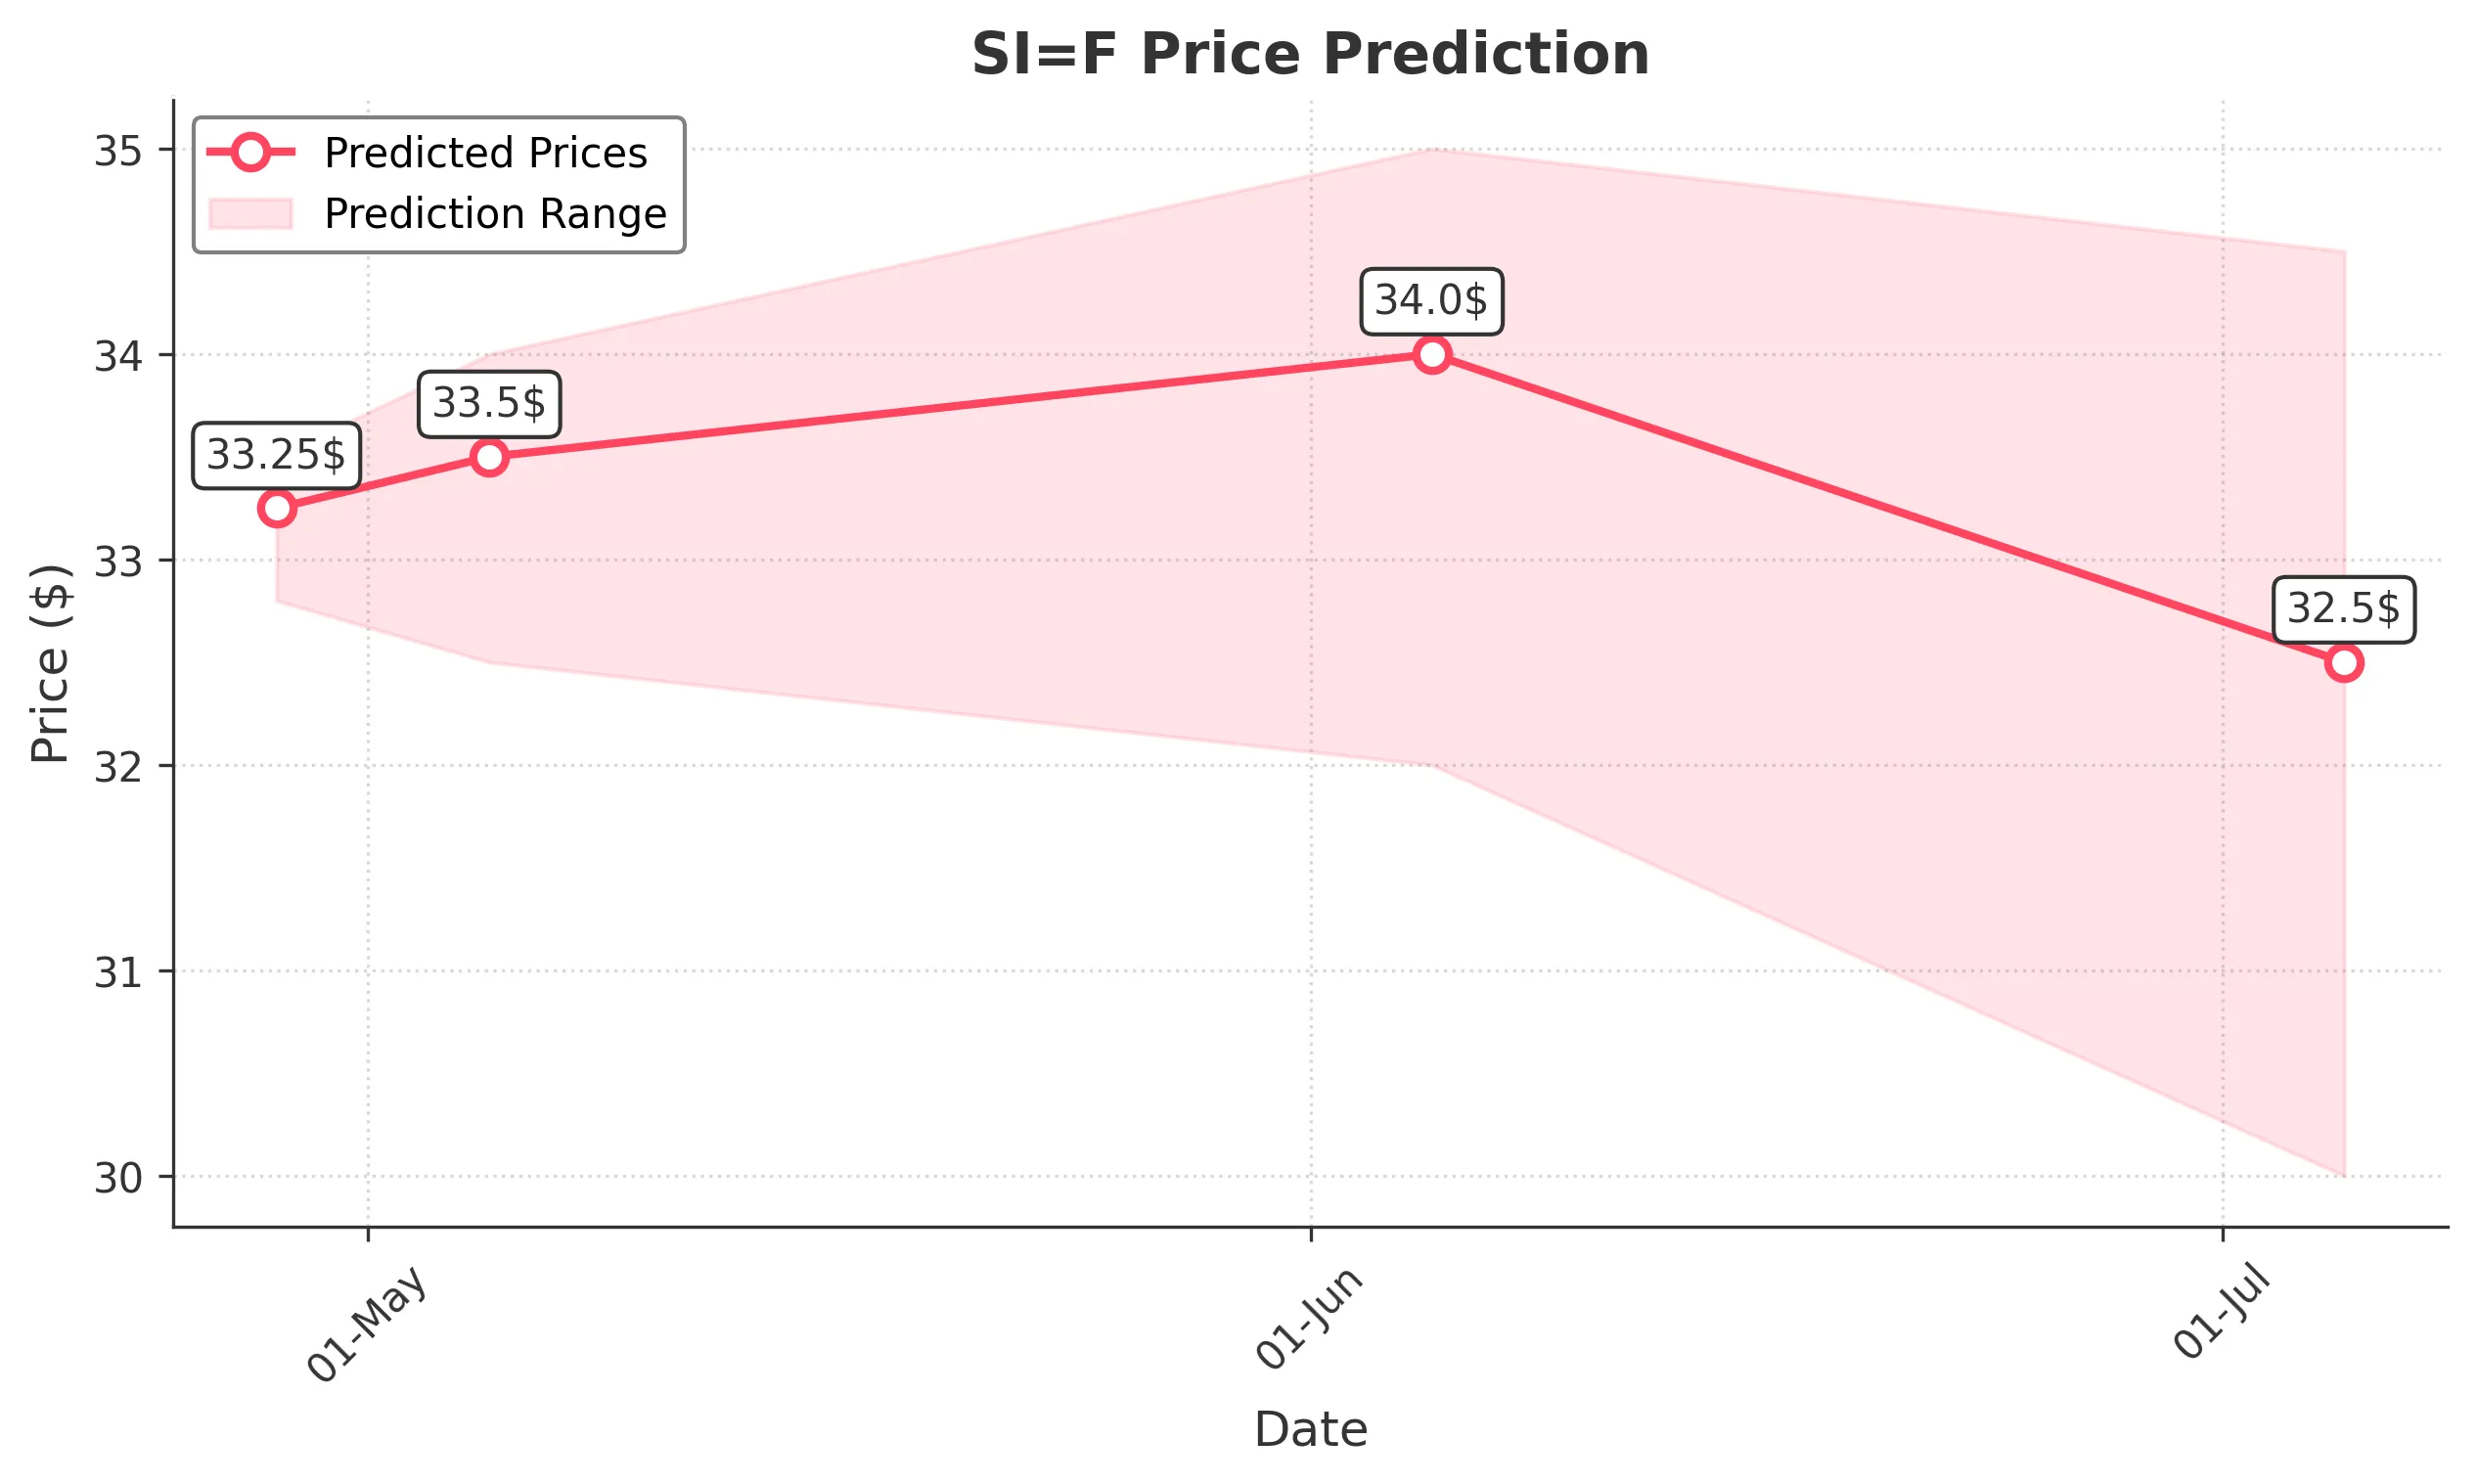
Target: April 28, 2025$33.25
$33.1
$33.5
$32.8
Description
The stock shows a bullish trend with a recent upward movement. The RSI is approaching overbought levels, indicating potential for a pullback. However, the MACD remains positive, suggesting continued upward momentum. Volume is stable, supporting the price action.
Analysis
Over the past 3 months, SI=F has shown a bullish trend with significant support around $32. The recent price action indicates a strong upward movement, but the RSI nearing overbought levels raises concerns about a possible pullback. Volume has been consistent, with some spikes indicating interest.
Confidence Level
Potential Risks
Potential market volatility and profit-taking could lead to a price drop.
1 Week Prediction
Target: May 5, 2025$33.5
$33.25
$34
$32.5
Description
The stock is expected to maintain its upward trajectory, supported by recent bullish candlestick patterns. The MACD remains positive, and the Bollinger Bands suggest potential for further price expansion. However, the RSI indicates overbought conditions.
Analysis
The stock has been in a bullish phase, with key resistance at $34. Recent candlestick patterns suggest continued upward momentum, but the overbought RSI signals caution. Volume trends are stable, but any negative news could reverse the current trend.
Confidence Level
Potential Risks
Market sentiment could shift due to external factors, impacting the stock's performance.
1 Month Prediction
Target: June 5, 2025$34
$33.5
$35
$32
Description
The stock is likely to experience a moderate increase, supported by bullish trends and positive market sentiment. However, the RSI indicates potential overbought conditions, which could lead to a correction. Watch for volume spikes as indicators of trend strength.
Analysis
SI=F has shown a strong bullish trend, but the RSI nearing overbought levels raises concerns about sustainability. Key support is around $32, while resistance is at $34. Volume patterns indicate interest, but external factors could introduce volatility.
Confidence Level
Potential Risks
Unforeseen macroeconomic events could impact the stock's trajectory.
3 Months Prediction
Target: July 5, 2025$32.5
$33
$34.5
$30
Description
The stock may face downward pressure due to potential profit-taking and market corrections. The RSI suggests overbought conditions, and the MACD may show signs of weakening momentum. Watch for volume changes as indicators of market sentiment.
Analysis
Over the past three months, SI=F has experienced a bullish trend, but signs of potential reversal are emerging. Key support is at $30, while resistance remains at $34. The stock's performance is influenced by broader market conditions and investor sentiment.
Confidence Level
Potential Risks
Market corrections and external economic factors could lead to significant price fluctuations.