SIF Trading Predictions
1 Day Prediction
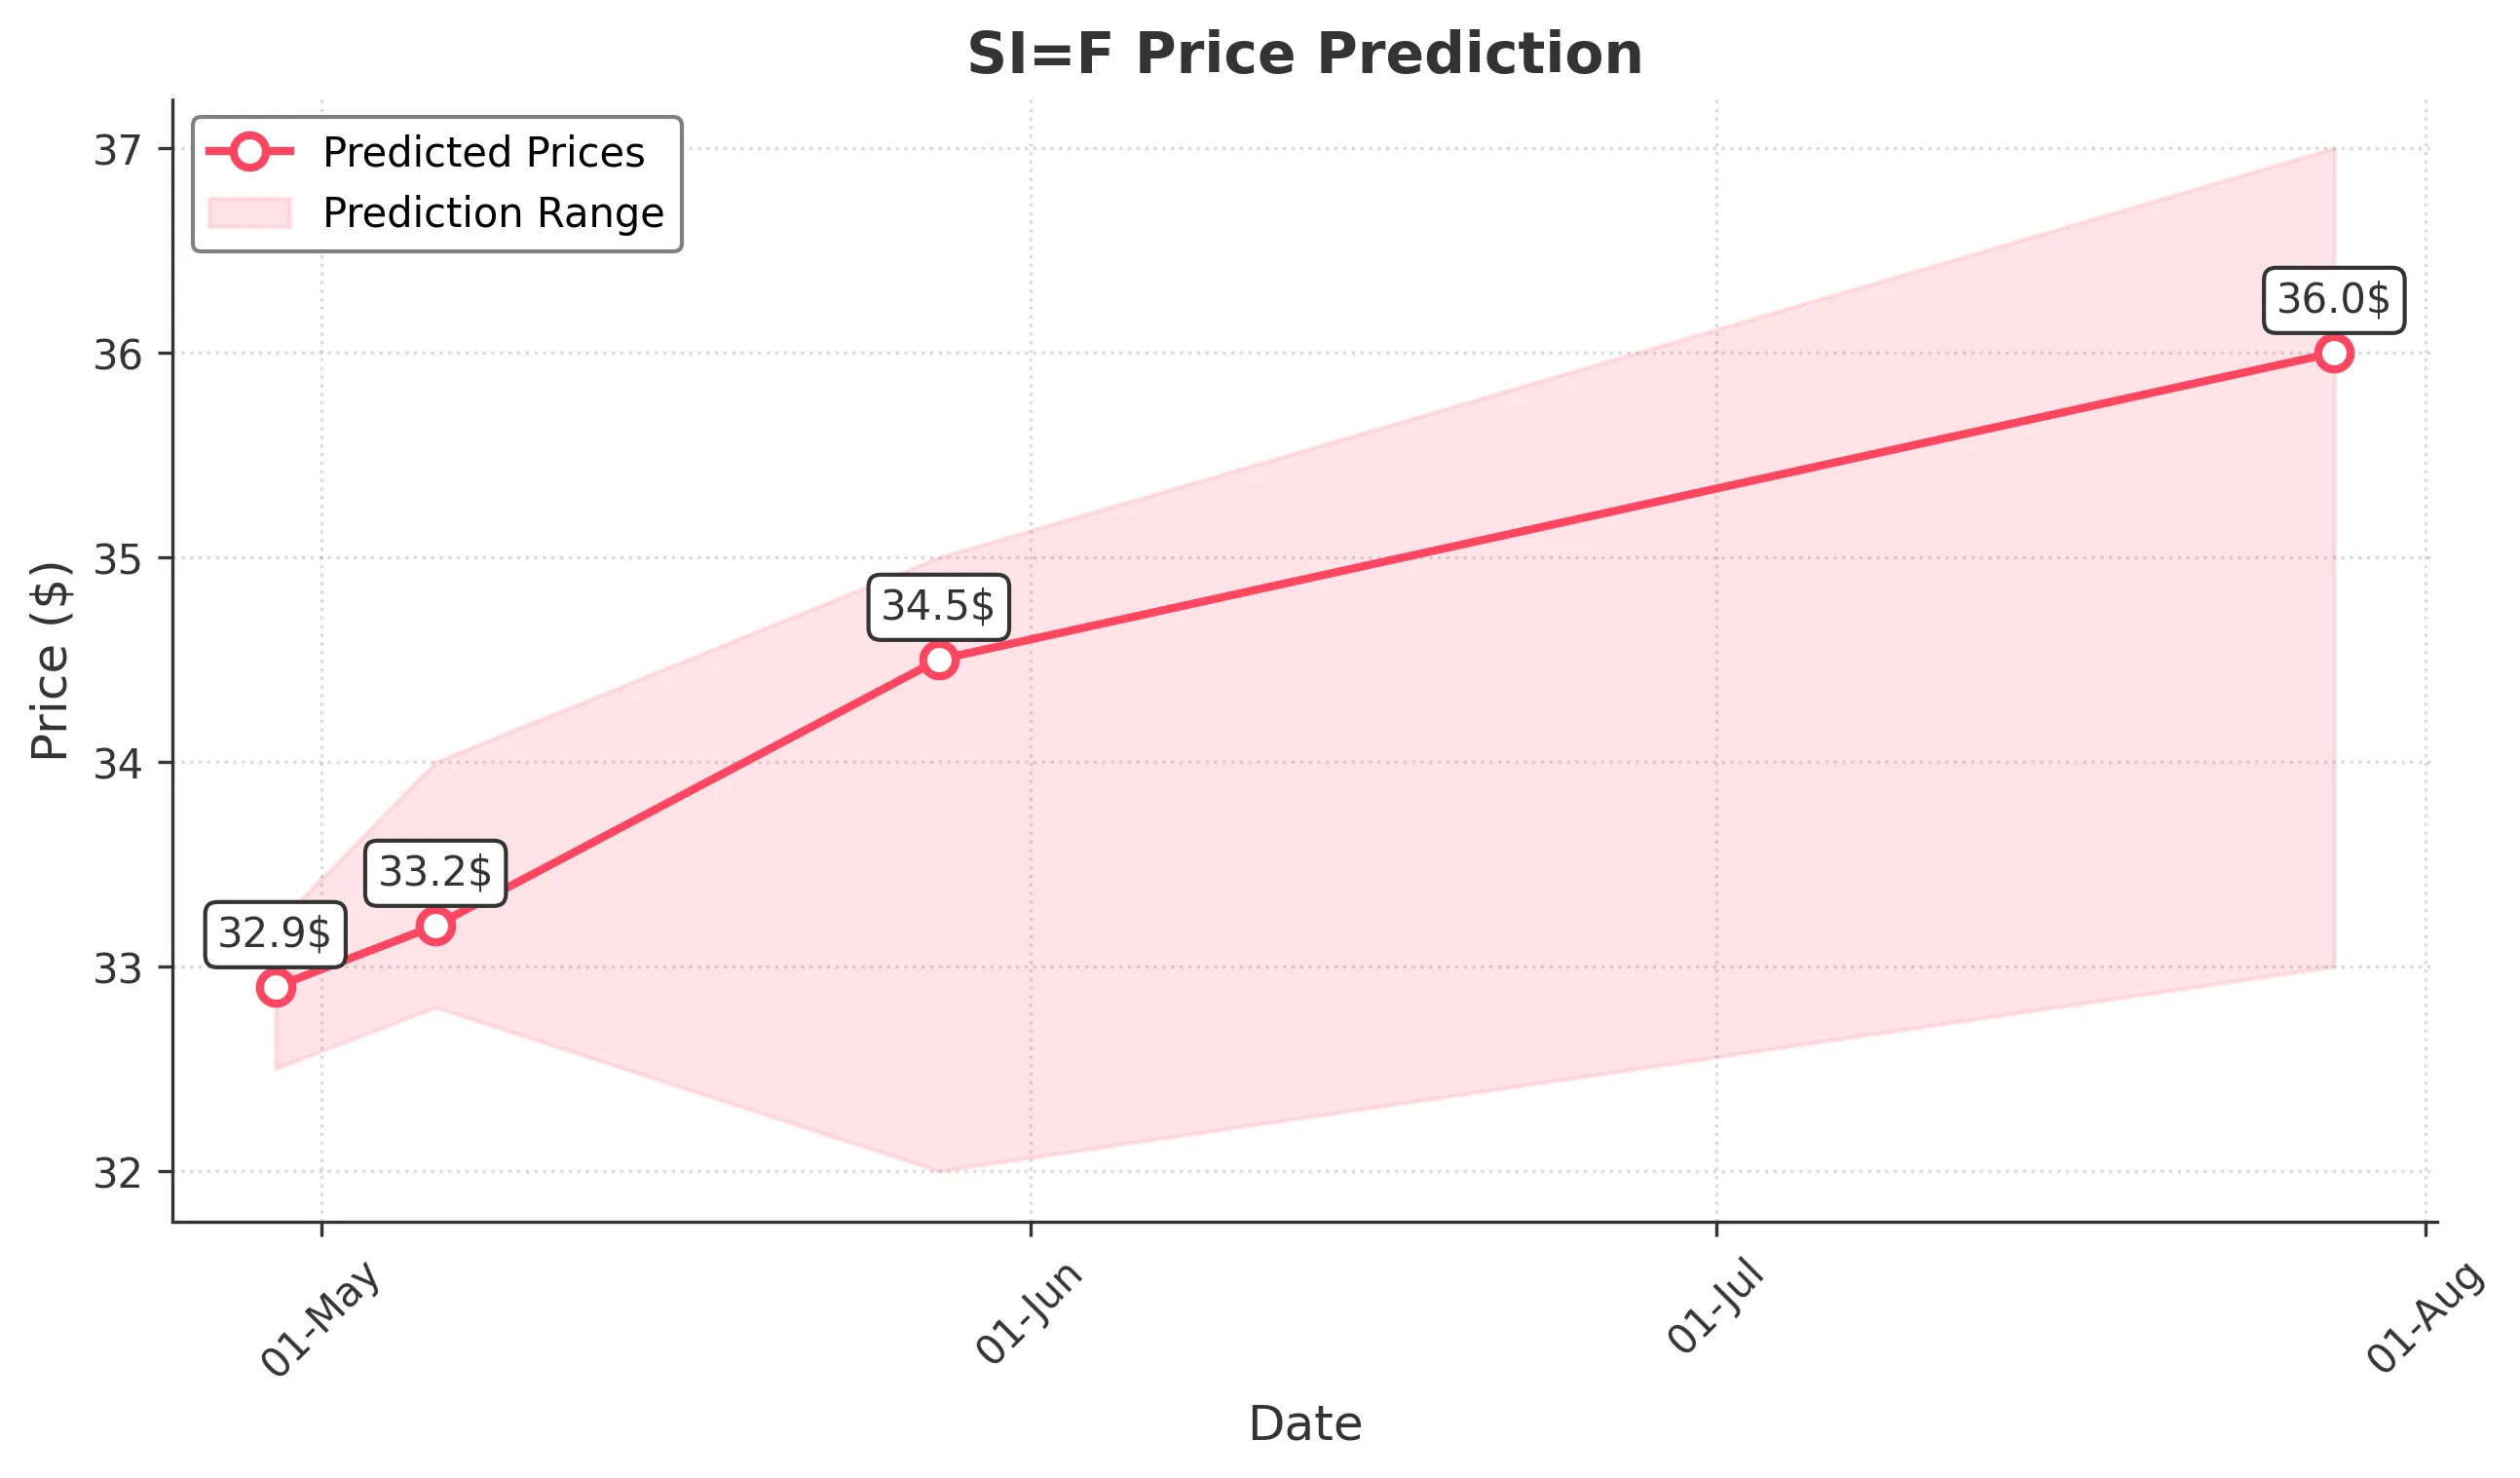
Target: April 29, 2025$32.9
$32.8
$33.2
$32.5
Description
The stock shows a slight bullish trend with recent support at 32.500. RSI indicates neutrality, while MACD is close to a bullish crossover. Volume is expected to increase slightly, indicating potential upward momentum.
Analysis
Over the past 3 months, SI=F has shown a mix of bullish and bearish trends, with significant resistance around 34.000. Recent price action suggests a potential recovery from lows, but uncertainty remains due to macroeconomic factors.
Confidence Level
Potential Risks
Market volatility and external news could impact the price unexpectedly.
1 Week Prediction
Target: May 6, 2025$33.2
$32.9
$34
$32.8
Description
The stock is likely to test resistance at 34.000. The recent bullish candlestick patterns suggest upward momentum, but the RSI indicates overbought conditions, which could lead to a pullback.
Analysis
The stock has been fluctuating around the 32.500 to 34.000 range. Technical indicators show mixed signals, with MACD indicating potential bullishness but RSI suggesting overbought conditions. Volume patterns are stable.
Confidence Level
Potential Risks
Potential profit-taking and market sentiment shifts could lead to volatility.
1 Month Prediction
Target: May 28, 2025$34.5
$33.5
$35
$32
Description
Expect a gradual increase towards 34.500, supported by bullish patterns and a favorable market sentiment. However, resistance at 35.000 may limit upside potential in the short term.
Analysis
The stock has shown resilience with a bullish trend in the last month. Key support at 32.000 and resistance at 35.000 are critical levels. Technical indicators suggest a potential upward trend, but caution is advised.
Confidence Level
Potential Risks
Economic data releases and geopolitical events could introduce volatility.
3 Months Prediction
Target: July 28, 2025$36
$35.5
$37
$33
Description
Long-term outlook remains bullish with potential to reach 36.000. Continued positive sentiment and technical indicators support this trend, but external economic factors could pose risks.
Analysis
The stock has been on a bullish trajectory, with key support at 33.000. Technical indicators suggest a strong upward trend, but external factors such as interest rates and economic data could impact performance.
Confidence Level
Potential Risks
Long-term predictions are subject to market shifts and economic changes.