SIF Trading Predictions
1 Day Prediction
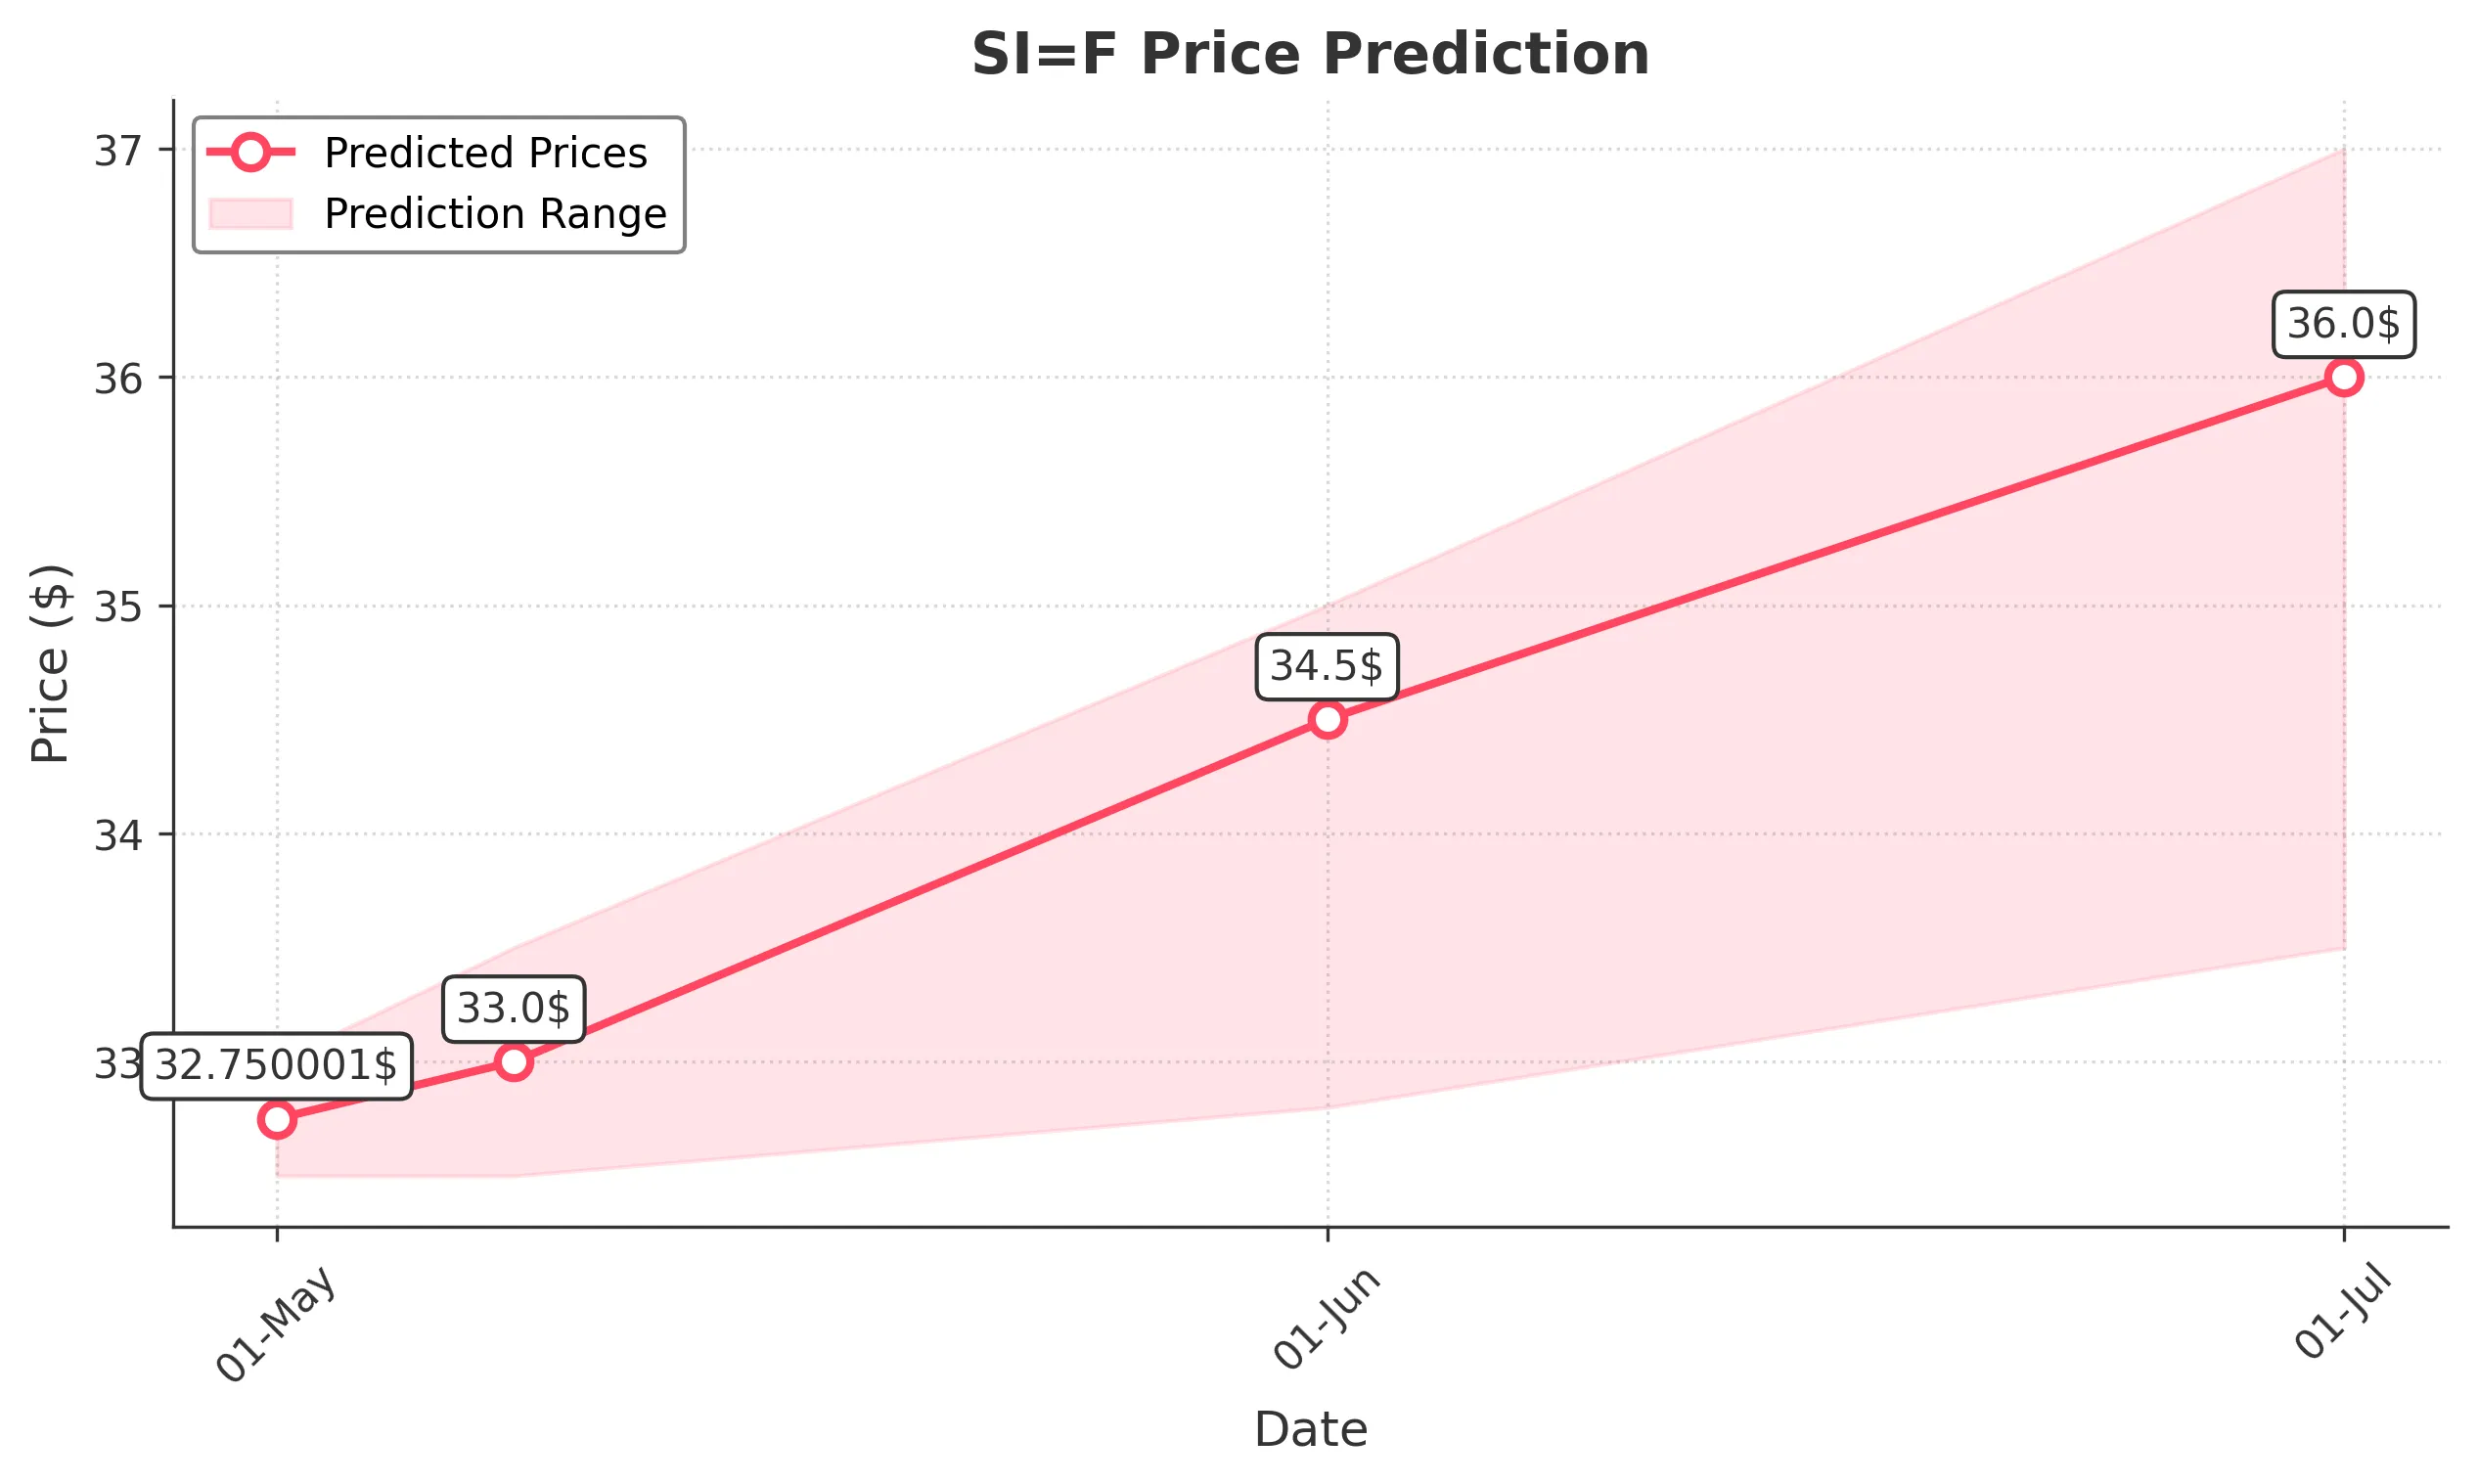
Target: May 1, 2025$32.750001
$32.900002
$33
$32.5
Description
The stock shows a slight bullish trend with a recent close above the 50-day moving average. RSI indicates neutrality, while MACD is close to crossing above the signal line. Expect minor fluctuations due to recent volatility.
Analysis
Over the past 3 months, SI=F has shown a bullish trend with significant resistance around 34.00. Recent volatility and volume spikes suggest uncertainty. The stock has bounced off support levels around 31.00, indicating potential for upward movement.
Confidence Level
Potential Risks
Potential market corrections or external news could impact the price.
1 Week Prediction
Target: May 8, 2025$33
$32.750001
$33.5
$32.5
Description
The stock is expected to maintain its upward momentum, supported by recent bullish candlestick patterns. The MACD is showing positive divergence, and the RSI is approaching overbought territory, indicating potential for a pullback.
Analysis
The stock has been trading in a range with resistance at 34.00 and support at 31.00. The recent bullish patterns suggest a potential breakout, but the RSI nearing overbought levels raises concerns about sustainability.
Confidence Level
Potential Risks
Market sentiment could shift due to macroeconomic factors, affecting the stock's performance.
1 Month Prediction
Target: June 1, 2025$34.5
$33
$35
$32.8
Description
Expect continued bullish momentum as the stock approaches key Fibonacci retracement levels. The MACD remains positive, and volume trends suggest increasing interest. However, watch for potential resistance at 35.00.
Analysis
The stock has shown a strong recovery from recent lows, with key support at 31.00. The bullish trend is supported by positive volume and technical indicators, but caution is warranted as it approaches resistance levels.
Confidence Level
Potential Risks
Unexpected market events or earnings reports could lead to volatility.
3 Months Prediction
Target: July 1, 2025$36
$34.5
$37
$33.5
Description
Long-term bullish outlook as the stock breaks through resistance levels. The MACD indicates strong momentum, and the RSI suggests sustained buying interest. However, external economic factors could introduce volatility.
Analysis
The stock has shown resilience with a bullish trend over the past three months. Key resistance levels are being tested, and while the outlook is positive, external factors could introduce risks to this trajectory.
Confidence Level
Potential Risks
Economic downturns or sector-specific issues could impact growth.