SIF Trading Predictions
1 Day Prediction
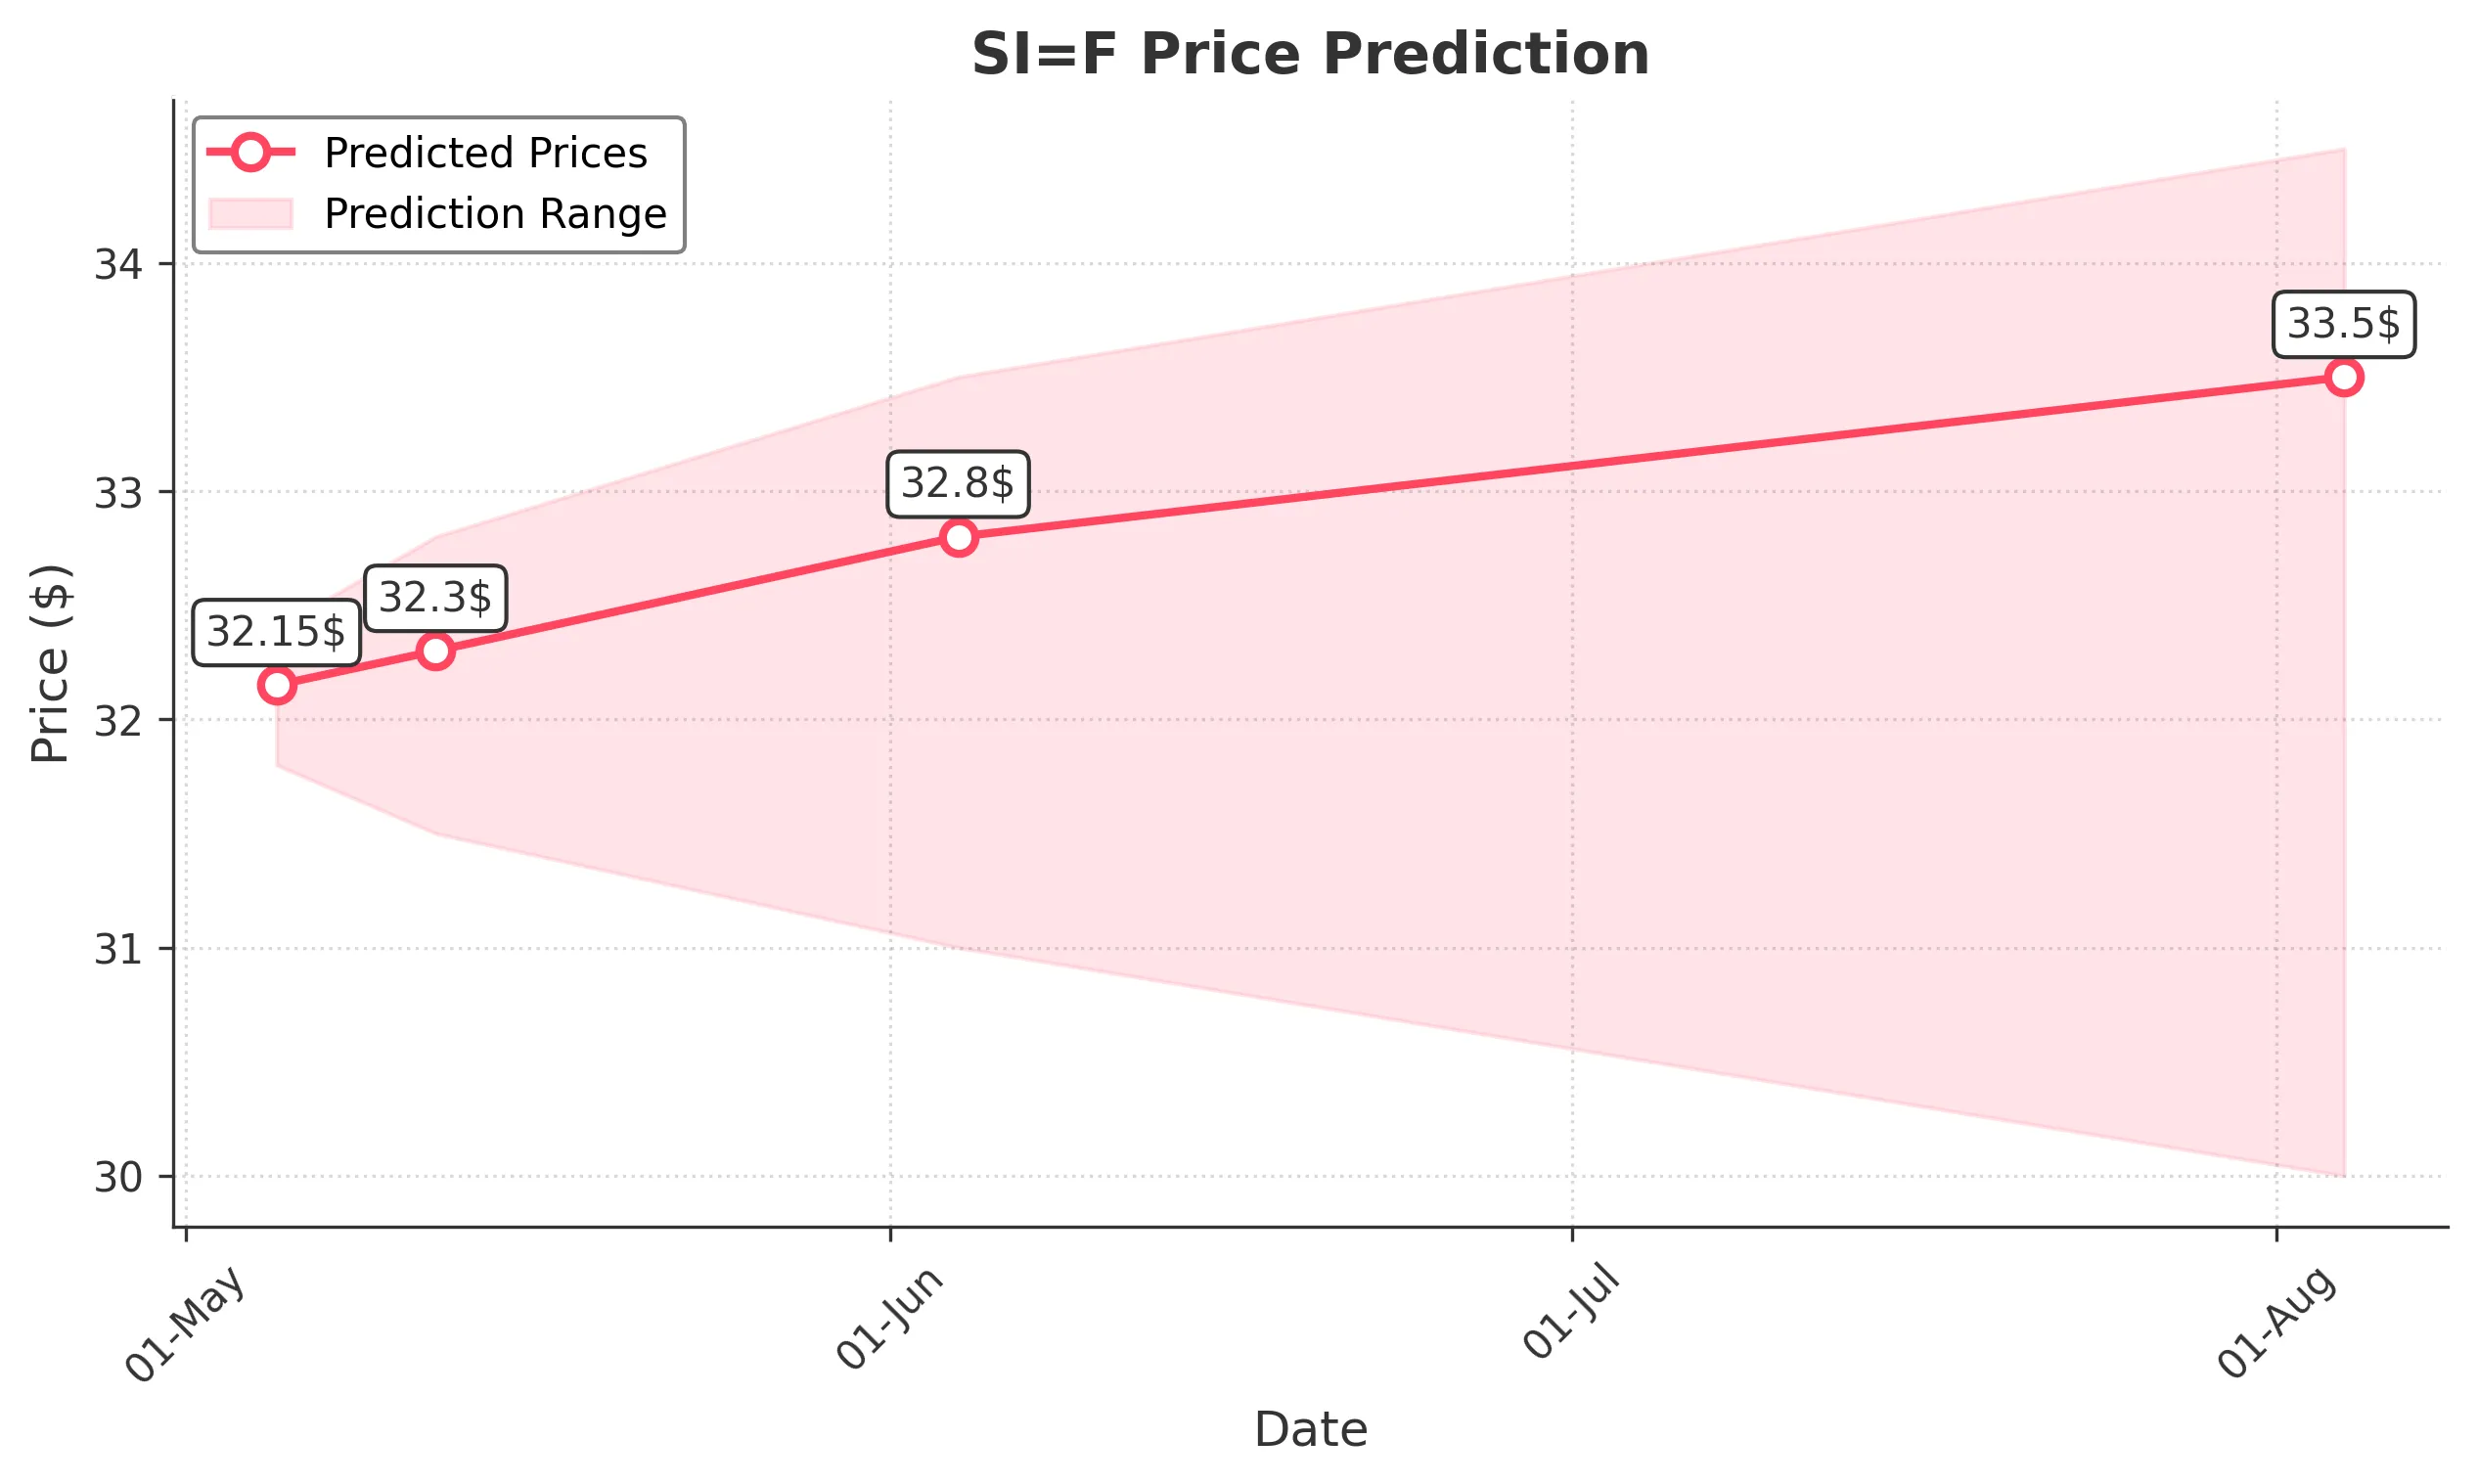
Target: May 5, 2025$32.15
$32.2
$32.4
$31.8
Description
The stock shows a slight bearish trend with recent lower closes. RSI indicates oversold conditions, but MACD is bearish. Expect a minor recovery, but volatility remains high due to recent price drops.
Analysis
Over the past 3 months, SI=F has shown a bearish trend with significant volatility. Key support at 31.800 and resistance at 34.500. Recent volume spikes indicate selling pressure. Technical indicators suggest potential for a short-term bounce, but risks remain.
Confidence Level
Potential Risks
Market sentiment is uncertain, and any negative news could lead to further declines.
1 Week Prediction
Target: May 12, 2025$32.3
$32.15
$32.8
$31.5
Description
Expect a slight recovery as the stock may find support around 31.800. However, bearish momentum persists, and any negative macroeconomic news could hinder upward movement.
Analysis
The stock has been in a downtrend, with significant resistance at 34.500. Recent candlestick patterns show indecision, and volume analysis indicates selling pressure. The overall sentiment remains cautious.
Confidence Level
Potential Risks
Potential for further declines if market sentiment worsens or if economic indicators are unfavorable.
1 Month Prediction
Target: June 4, 2025$32.8
$32.3
$33.5
$31
Description
A potential recovery is anticipated as the stock may stabilize around 32.800. However, bearish signals from MACD and RSI suggest caution. Watch for external economic factors.
Analysis
The stock has experienced significant fluctuations, with key support at 31.000 and resistance at 34.500. Technical indicators show mixed signals, indicating potential for both upward and downward movements.
Confidence Level
Potential Risks
Market volatility and external economic conditions could lead to unexpected price movements.
3 Months Prediction
Target: August 4, 2025$33.5
$32.8
$34.5
$30
Description
Longer-term outlook suggests a potential recovery towards 33.500, but risks remain due to macroeconomic uncertainties. Watch for key support levels.
Analysis
The stock has shown a bearish trend with high volatility. Key support at 30.000 and resistance at 34.500. Technical indicators suggest potential for recovery, but external factors could lead to further declines.
Confidence Level
Potential Risks
Unforeseen economic events or changes in market sentiment could significantly impact the stock's performance.