SIF Trading Predictions
1 Day Prediction
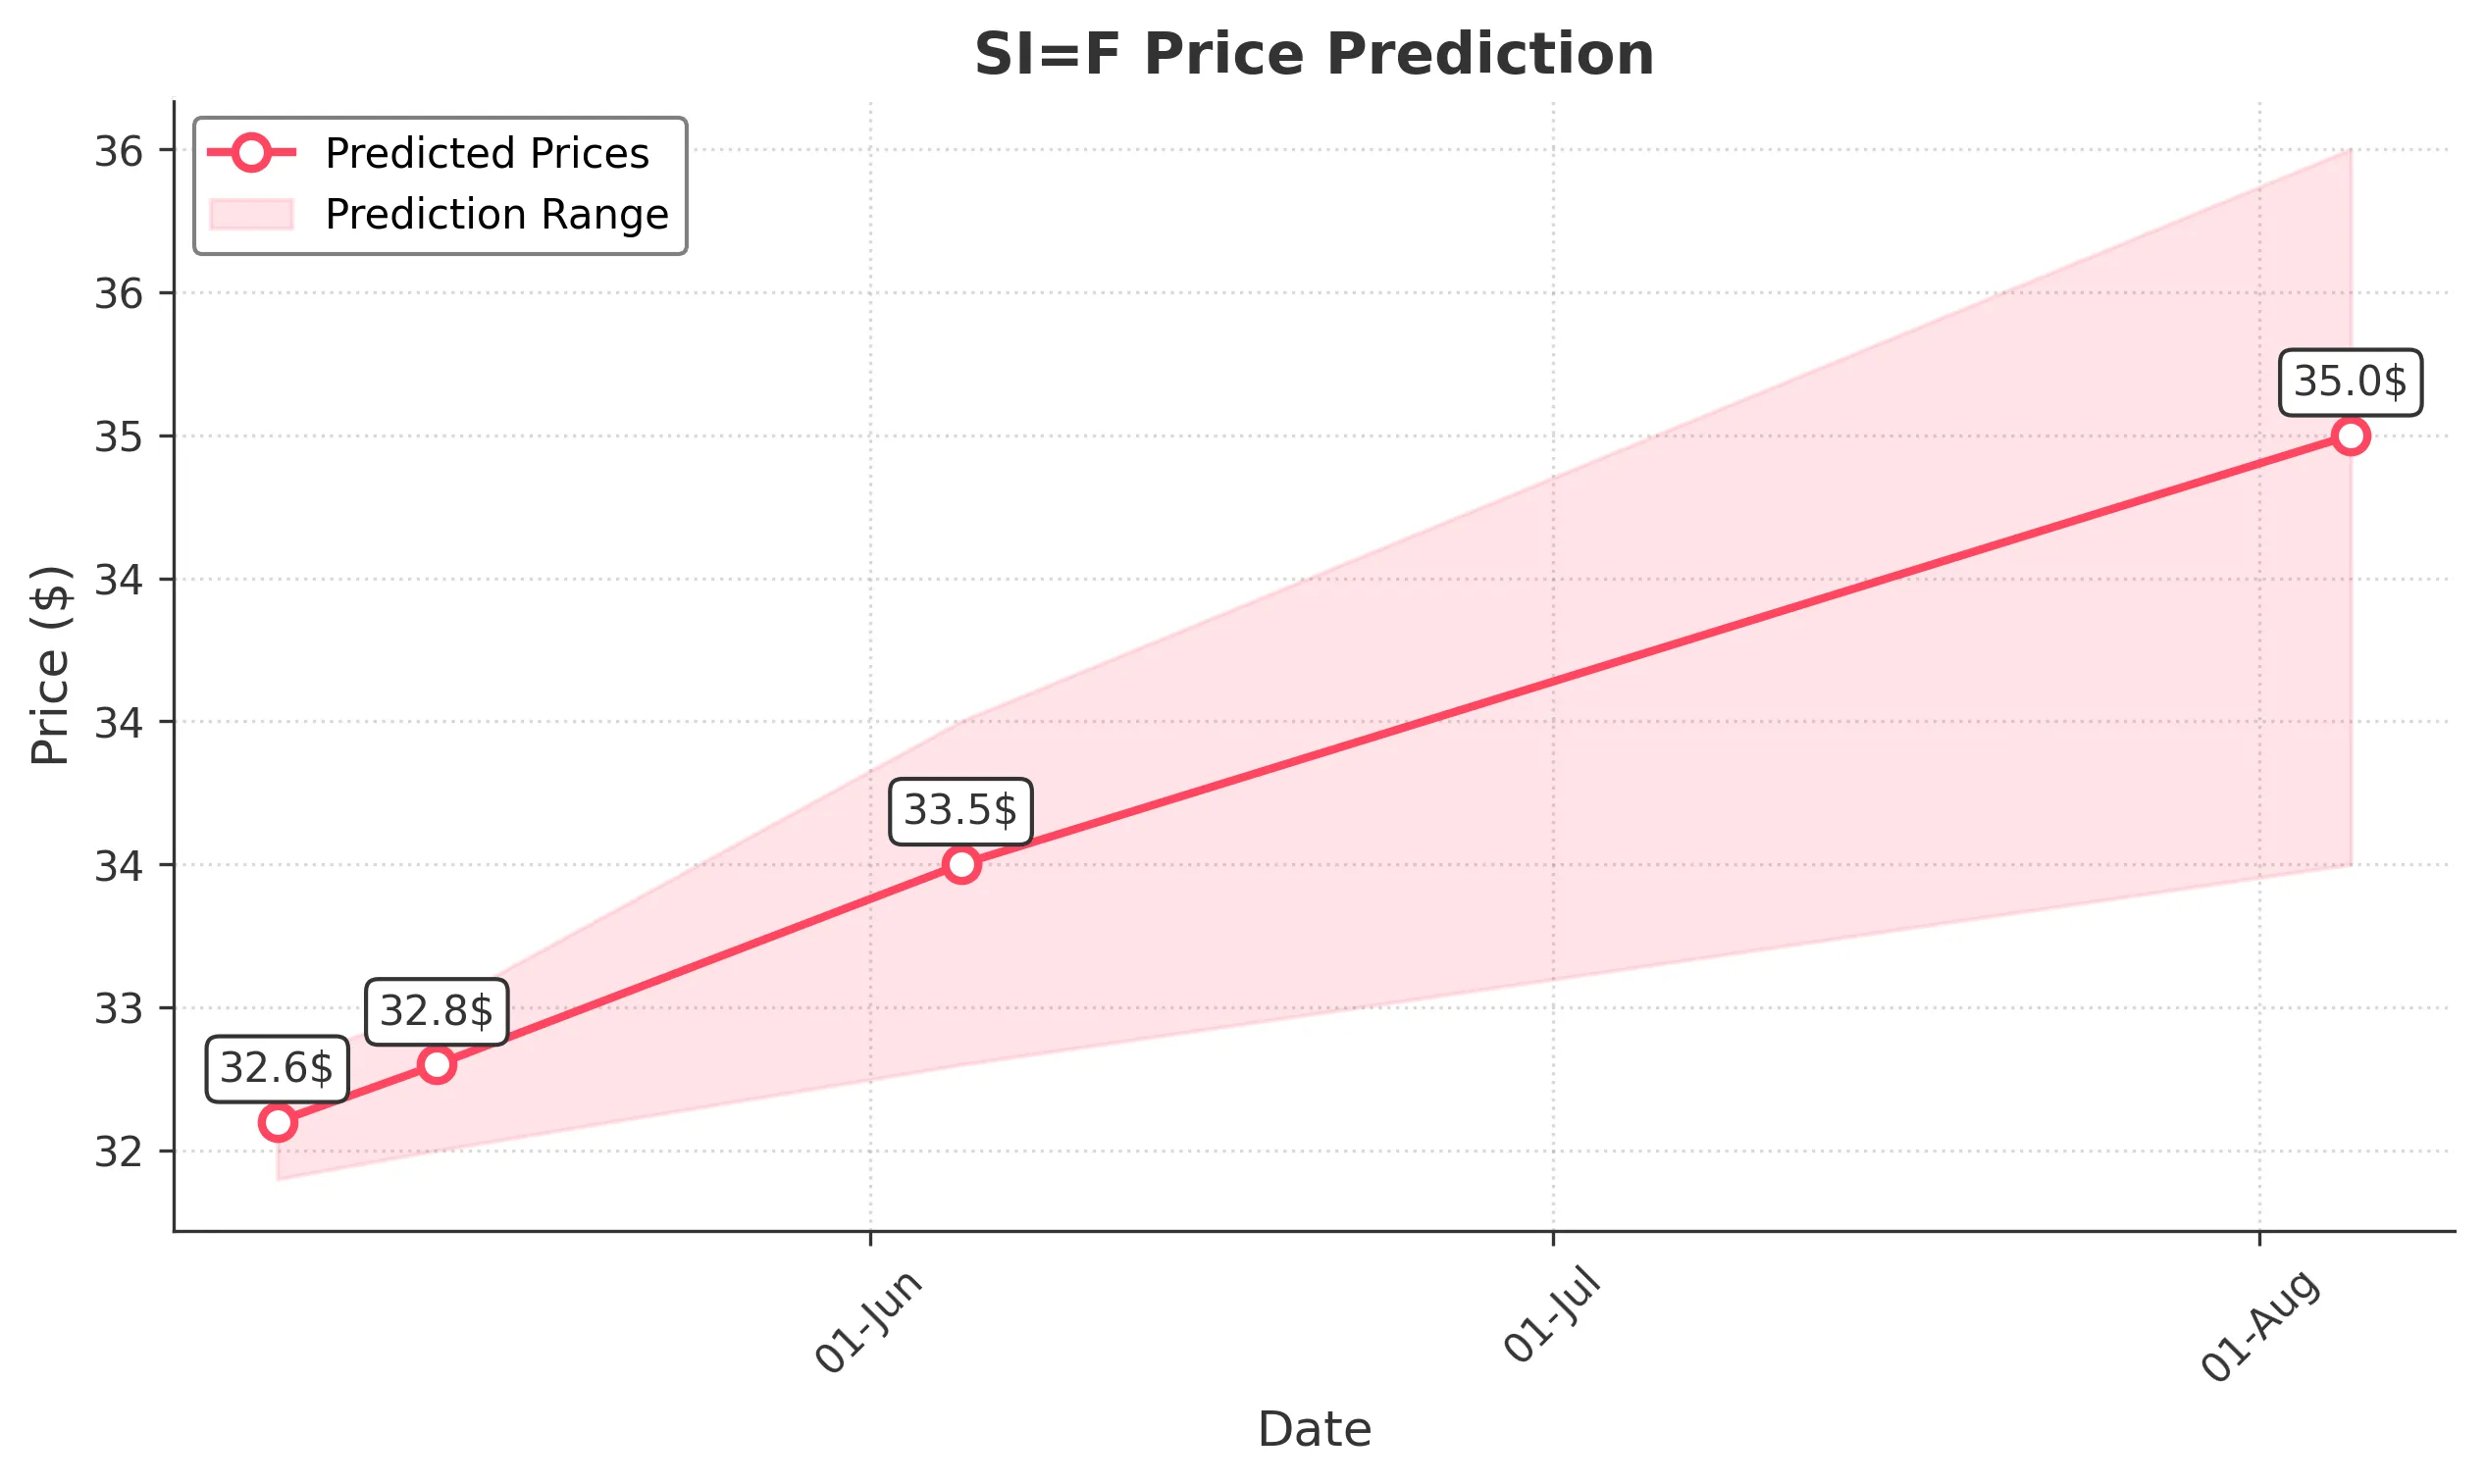
Target: May 6, 2025$32.6
$32.55
$32.8
$32.4
Description
The stock shows a slight bullish trend with a recent close of 32.549999. RSI indicates neutrality, while MACD is close to crossing above the signal line. Expect minor fluctuations within the Bollinger Bands.
Analysis
Over the past 3 months, SI=F has shown a bearish trend recently, with significant support around 32.00. The recent price action indicates a potential reversal, but the overall sentiment remains cautious.
Confidence Level
Potential Risks
Potential volatility due to market sentiment and external news could impact the prediction.
1 Week Prediction
Target: May 13, 2025$32.8
$32.6
$33
$32.5
Description
The stock is expected to recover slightly as it approaches key resistance levels. The MACD shows potential bullish momentum, while the RSI is nearing oversold territory, suggesting a bounce back.
Analysis
The stock has been trading sideways with a recent bearish trend. Key resistance is at 33.00, while support remains at 32.00. Volume has been low, indicating a lack of strong conviction in either direction.
Confidence Level
Potential Risks
Market volatility and external economic factors could lead to unexpected price movements.
1 Month Prediction
Target: June 5, 2025$33.5
$32.9
$34
$32.8
Description
A gradual recovery is anticipated as the stock approaches the Fibonacci retracement level of 33.50. The MACD is showing signs of bullish divergence, and the RSI is stabilizing.
Analysis
The stock has experienced significant fluctuations, with a recent bearish phase. However, the potential for recovery exists as it approaches key Fibonacci levels. Volume patterns suggest accumulation at lower levels.
Confidence Level
Potential Risks
Economic indicators and market sentiment could shift, impacting the recovery trajectory.
3 Months Prediction
Target: August 5, 2025$35
$34
$36
$33.5
Description
Long-term bullish sentiment is expected as the stock breaks through resistance levels. The MACD is likely to confirm a bullish trend, and the RSI should stabilize above 50.
Analysis
The stock has shown a mix of bullish and bearish trends over the past three months. Key resistance levels are being tested, and if broken, a bullish trend could emerge. However, external factors remain a risk.
Confidence Level
Potential Risks
Unforeseen macroeconomic events could alter the bullish outlook significantly.